Life360 Reports Record Q1 2025 Results
PDF Version
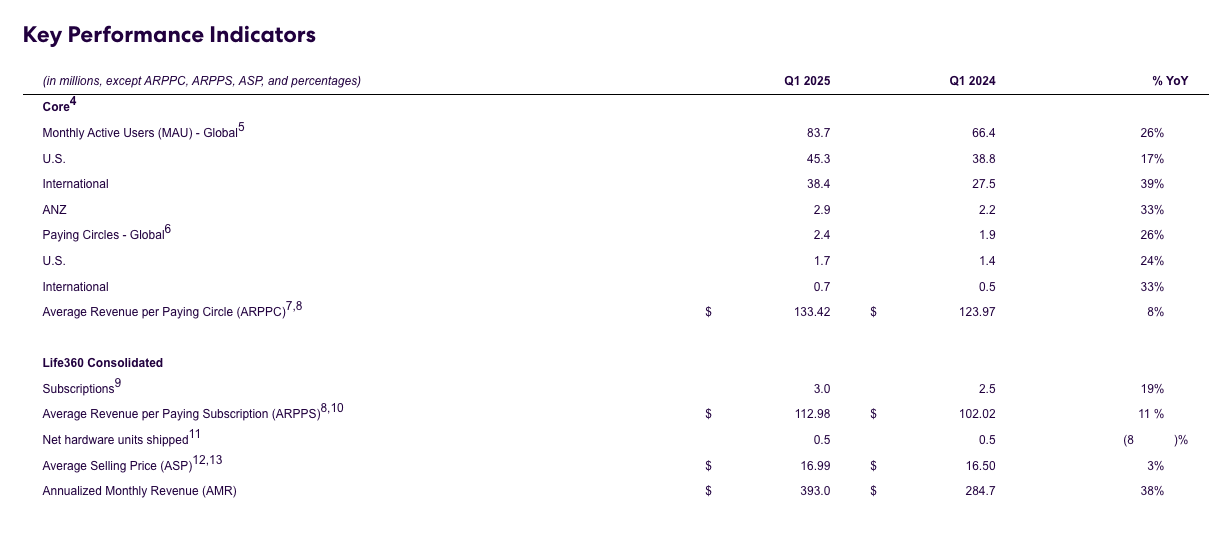
Monthly Active Users Reached Approximately 83.7 million
Record Q1 Global Net Additions to Paying Circles of 137 thousand - Reaching 2.4 million Total
Total Quarterly Revenue Grew 32% Year-Over-Year to $103.6 million
Annualized Monthly Revenue increased 38% Year-Over-Year to $393.0 million
SAN FRANCISCO, May 12, 2025 (GLOBE NEWSWIRE) -- Life360, Inc. (“Life360” or the “Company”) (NASDAQ: LIF, ASX: 360), the San Francisco-based leader in family safety and connection, today announced unaudited financial results for the first quarter ended March 31, 2025. Building on continuing momentum from prior quarters, the Company achieved record-breaking results across key metrics, including Monthly Active Users (MAUs), Paying Circles, Subscription Revenue, and Annualized Monthly Revenue.
“Life360 started 2025 strongly, achieving record highs in MAUs, subscribers, and Q1 net additions, while making meaningful progress against our strategic roadmap,” said Life360 Co-founder and Chief Executive Officer Chris Hulls.
“In a more cautious consumer spending environment, our performance reflects both the resilience of our business model and the growing demand for our services that keep families safe, connected, and provide peace of mind. As a trusted daily essential for millions, we are uniquely positioned to support families through uncertain times—and beyond.”
Life360 Chief Financial Officer Russell Burke added: “Life360 demonstrated continued strong growth and meaningful margin expansion in Q1, with total revenue of $103.6 million — up 32% year-over-year — while keeping total operating expense growth to 23% YoY, This operational discipline drove Net Income of $4.4 million, our tenth consecutive quarter of positive Adjusted EBITDA (1), and our eighth consecutive quarter of positive Operating Cash Flow. Looking ahead, even as consumer financial pressures intensify, our core subscription business remains resilient and we have largely mitigated the impacts of an uncertain tariff environment, so that the anticipated overall impact is not material. We remain confident in our ability to continue delivering positive Adjusted EBITDA (1) throughout 2025. Our focus on balancing strong top-line growth with expanding profitability positions us well to succeed in increasingly demanding market conditions.”
Q1'25 Financial Highlights
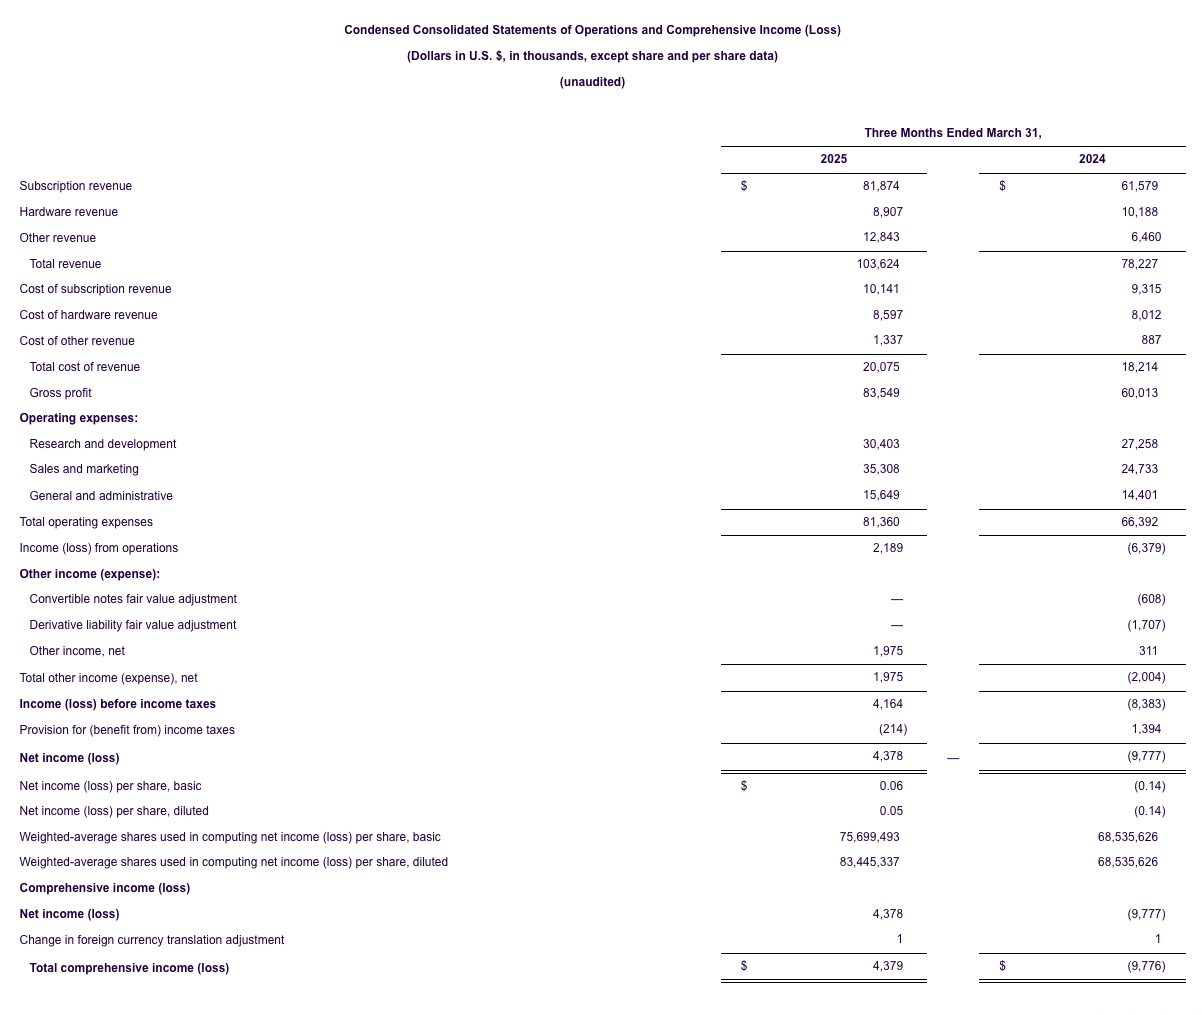
Total Q1'25 revenue of $103.6 million, a YoY increase of 32%, with total subscription revenue of $81.9 million, up 33% YoY and Core subscription revenue (2) of $76.2 million, up 37% YoY.
Annualized Monthly Revenue (AMR) of $393.0 million, up 38% YoY.
Q1'25 Net Income of $4.4 million, which includes other income of $2.0 million related to dividend and interest income and a benefit from income tax (3) of $0.2 million.
Adjusted EBITDA (1) of $15.9 million compared to $4.3 million in Q1'24.
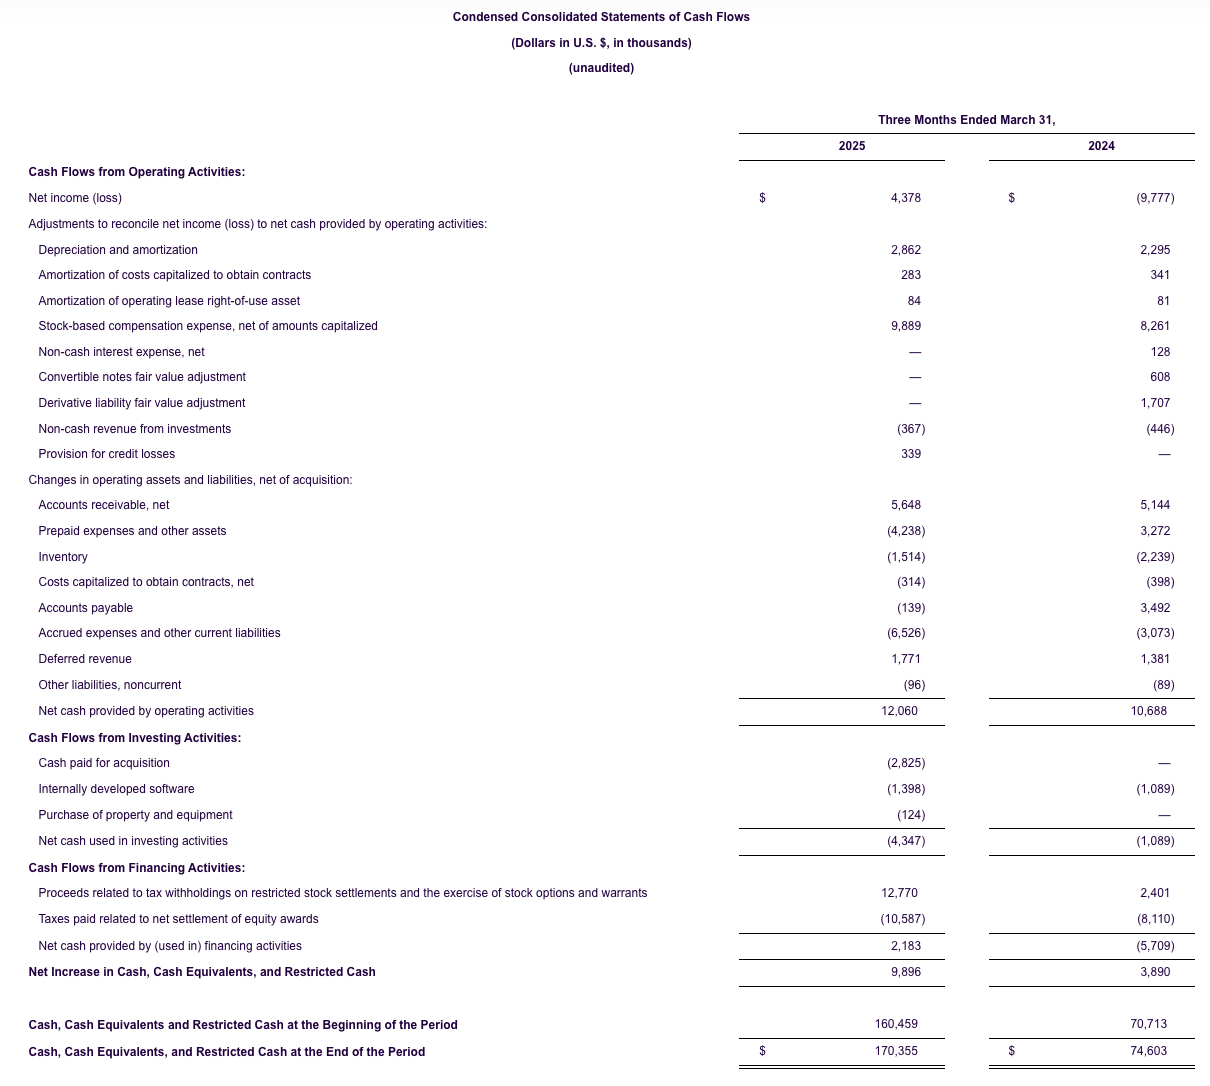
Positive Operating Cash Flow of $12.1 million, up 13% YoY.
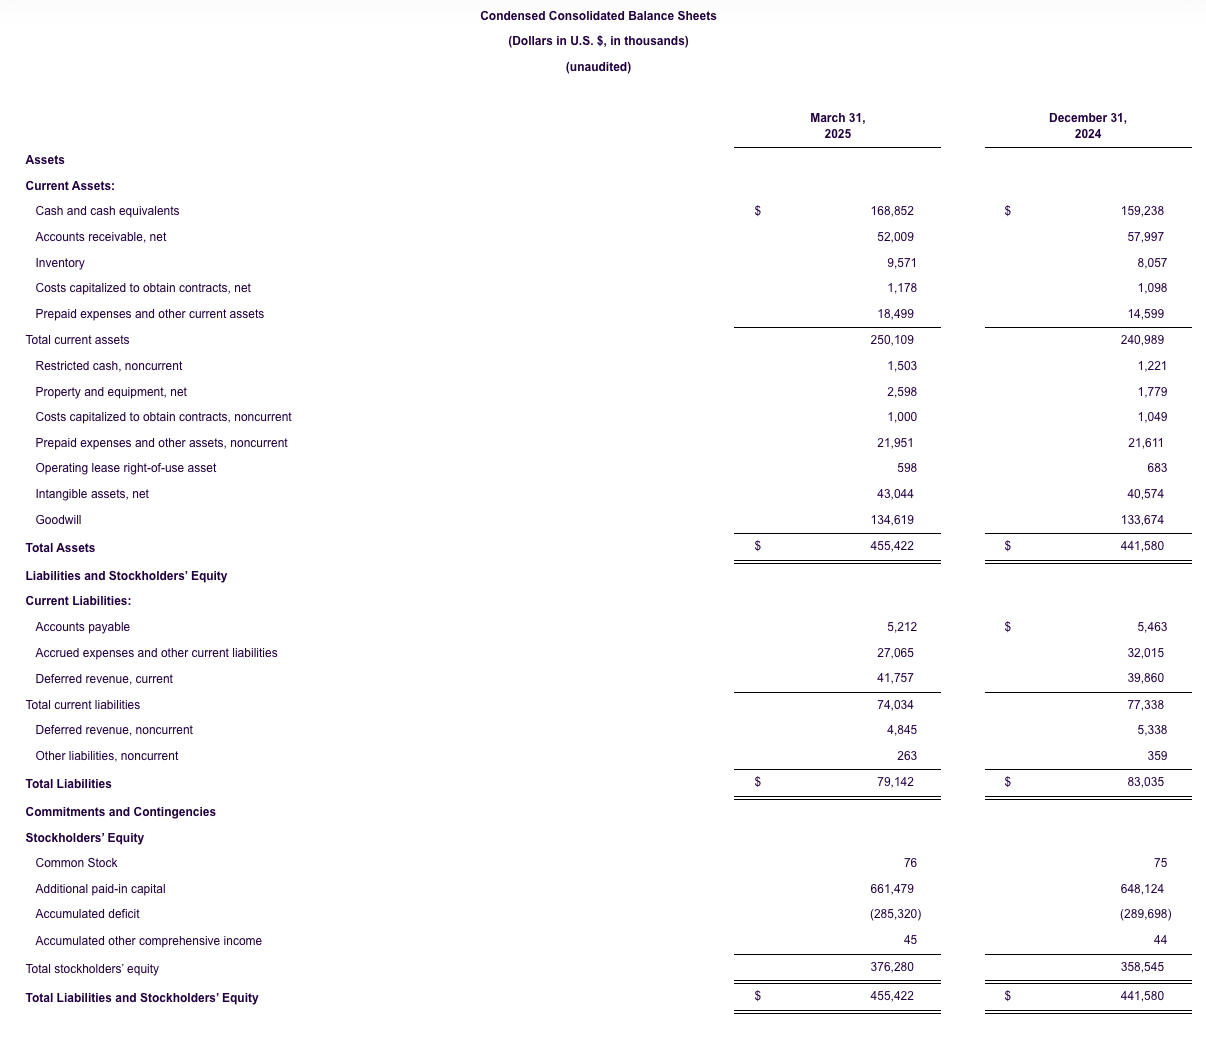
Quarter-end cash, cash equivalents and restricted cash of $170.4 million, an increase of $95.8 million from Q1'24, which was primarily the result of net capital raised from the U.S. IPO in Q2’24.
Note: The financial information in this announcement may not add or recalculate due to rounding. All references to $ are to U.S. dollars.
Q1'25 Operating Highlights
Q1'25 global MAU net additions were 4.1 million, which picked up seasonally after a softer Q4’24. Total MAUs increased 26% YoY to approximately 83.7 million, with significant contribution from organic growth.
Q1'25 global Paying Circle net additions of 137 thousand were up 43% YoY. Total Paying Circles grew 26% YoY to 2.4 million, supported by improved retention in the U.S.
Average Revenue Per Paying Circle (“ARPPC”) increased 8% YoY primarily due to U.S. price increases for new and existing subscribers and a shift in product mix toward higher-priced offerings, along with legacy price increases, the launch of Dual Tier memberships in non-Triple Tier countries, and continued growth in Triple Tier memberships in the UK and ANZ.
1. Adjusted EBITDA is a Non-GAAP measure. For more information, including the definition of Adjusted EBITDA, the use of this non-GAAP measure, as well as a reconciliation of Net Income (Loss) to Adjusted EBITDA, refer to the “Adjusted EBITDA” and “Supplementary and Non-GAAP Financial Information” sections below.
2. Core subscription revenue is defined as subscription revenue derived from the Life360 mobile application and excludes non-core subscription revenue which relates to other hardware related subscription offerings. For more information, including the use of this measure, refer to the “Core subscription revenue” section below.
3. The provision for (benefit from) income taxes for interim quarterly reporting periods is based on the Company's estimates of the effective tax rates for the full fiscal year in accordance with ASC 740-270, Income Taxes, Interim Reporting. ASC 740-270-25-2 requires that an annual effective tax rate be determined and such annual effective rate be applied to year to date income (loss) in interim periods. The effective tax rate in any quarter may be subject to fluctuations during the year as new information is obtained, which may positively or negatively affect the assumptions used to estimate the annual effective tax rate, including factors such as valuation allowances against deferred tax assets, the recognition or de-recognition of tax benefits related to uncertain tax position, if any, and changes in or the interpretation of tax laws in jurisdictions where the Company conducts business.
Note: The financial information in this announcement may not add or recalculate due to rounding. All references to $ are to U.S. dollars.
4. Core metrics relate solely to the Life360 mobile application.
5. A monthly active user (“MAU”) is defined as a unique member who engages with our Life360 branded services each month, which includes both paying and non-paying members, and excludes certain members who have a delayed account setup.
6. A Paying Circle is defined as a group of Life360 members with a paying subscription that has been billed as of the end of a period.
7. ARPPC is defined as annualized subscription revenue recognized and derived from the Life360 mobile application, excluding certain revenue
adjustments related to bundled Life360 subscription and hardware offerings, for the reported period divided by the Average Paying Circles during the
same period.
8. Excludes revenue related to bundled Life360 subscription and hardware offerings of $(0.4) million and $(1.2) million for the three months ended March 31, 2025 and the three months ended March 31, 2024, respectively.
9. Subscriptions are defined as the number of paying subscribers associated with the Life360, Jiobit and Tile brands who have been billed as of the end of the period.
10. ARPPS is defined as annualized total subscription revenue recognized and derived from Life360, Tile and Jiobit subscriptions, excluding certain
revenue adjustments related to bundled Life360 subscription and hardware offerings, for the reported period divided by the average number of
paying subscribers during the same period.
11. Net hardware units shipped represent the number of tracking devices sold during the period, excluding hardware units related to bundled Life360 subscription and hardware offerings, net of returns by our retail partners and directly to consumers.
12. Excludes revenue related to bundled Life360 subscription and hardware offerings of $0.4 million and $1.2 million for the three months ended March 31, 2025 and the three months ended March 31, 2024, respectively..
13. To determine the net ASP of a unit, we divide hardware revenue recognized, excluding revenue related to bundled Life360 subscription and hardware offerings, for the reported period by the number of net hardware units shipped during the same period.
Global MAUs increased 26% YoY to approximately 83.7 million, with Q1'25 net additions of 4.1 million. U.S. MAUs increased 17% YoY, with Q1'25 net adds of 1.7 million. International MAUs increased 39% YoY, with Q1'25 net adds of 2.4 million. Total MAUs in the Triple Tier markets of the UK, Canada, and ANZ increased 36% YoY.
Q1'25 global Paying Circle net additions of 137 thousand, a Q1 record, were driven by strong performance in both U.S. and international markets. U.S. Paying Circles increased 24% YoY on the back of improved retention metrics. International Paying Circles maintained strong momentum, up 33% YoY. Total Paying Circles in the Triple Tier markets of the UK, Canada, and ANZ increased 26% YoY.
Q1'25 global ARPPC increased 8% YoY. U.S. ARPPC increased 5% YoY, benefiting from price increases for new and existing subscribers implemented in September 2024 and October 2024, respectively, as well as a shift in product mix towards higher priced products. Q1’25 international ARPPC increased 39% YoY due to legacy subscriber price increases and the launch of Dual Tier in non-Triple Tier markets, as well as legacy subscriber price increases in the Triple Tier UK and ANZ markets.
Q1'25 net hardware units shipped decreased 8% YoY primarily due to a decrease in enterprise channel sales. The Average Selling Price of hardware units shipped increased 3% YoY primarily due to a shift in channel mix and fewer returns.
March 2025 AMR increased 38% YoY, benefiting from accelerating subscription revenue momentum and increasing other revenue over the course of Q1'25.
Note: The financial information in this announcement may not add or recalculate due to rounding. All references to $ are to U.S. dollars.
Operating Results
Revenue
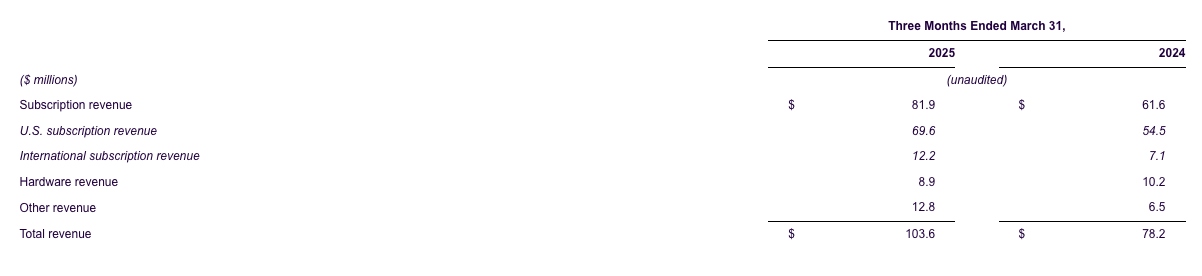
Q1'25 total subscription revenue increased 33% YoY to $81.9 million, primarily driven by growth in Paying Circles.
Q1'25 hardware revenue decreased 13% YoY to $8.9 million, primarily driven by a reduction in bundled offerings and an increase in discounts.
Q1'25 other revenue increased 99% YoY to $12.8 million due to increases in data and partnership revenue, which includes advertising revenue.
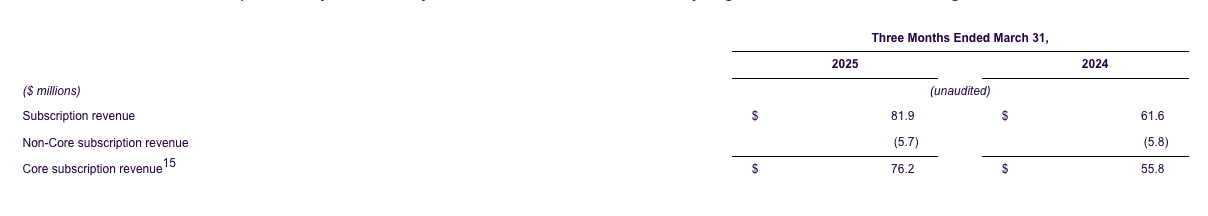
Core Subscription Revenue
Core subscription revenue is defined as GAAP subscription revenue derived from the Life360 mobile application and excludes non-core subscription revenue, which we define as GAAP subscription revenue from other hardware related subscription offerings, for the reported period. Core subscription revenue represents revenue derived from and the overall success of our core product offering. Q1'25 core subscription revenue increased 37% YoY primarily driven by a 26% YoY increase in Paying Circles and an 8% higher ARPPC. (14)
14. Refer to the ‘Key Performance Indicators’ section above for additional information regarding the impact of bundled offerings on KPI calculations for the periods presented.
15. Beginning with the second quarter of 2024, this definition was updated and calculated in accordance with GAAP.
Gross Profit
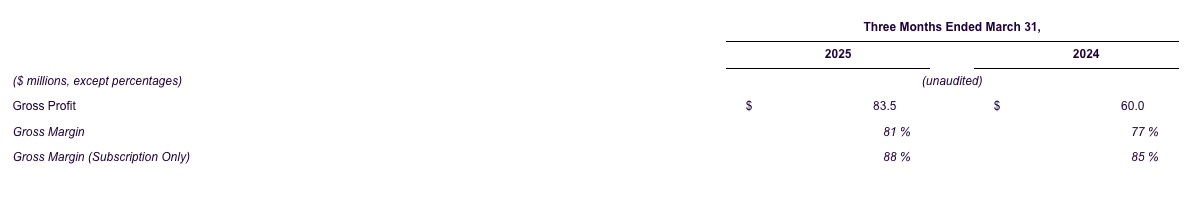
Q1'25 gross margin increased to 81% from 77% in the prior year period, primarily due to the increased proportion of other revenue.
Note: The financial information in this announcement may not add or recalculate due to rounding. All references to $ are to U.S. dollars.
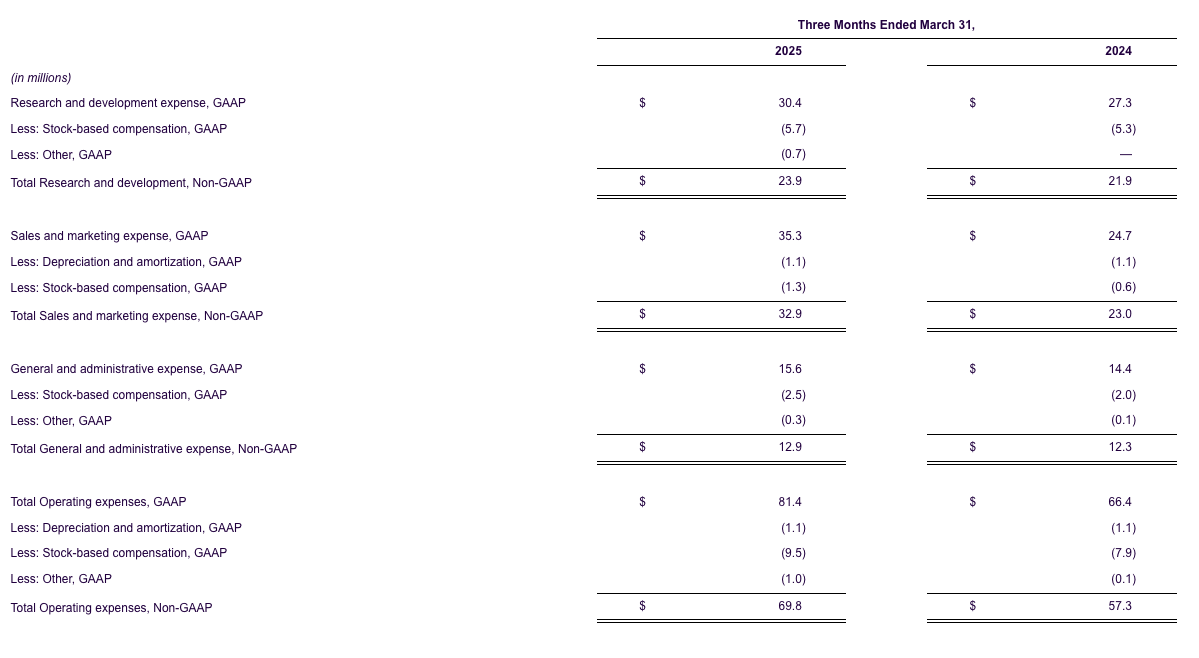
Operating Expenses
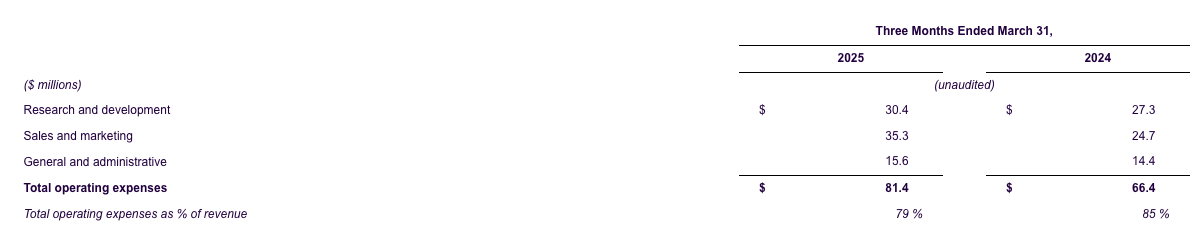
Q1'25 operating expenses, excluding commissions, increased 21% YoY despite revenue growth of 32%, demonstrating continued strong operating leverage.
Q1'25 research and development costs increased 12% YoY, primarily driven by higher personnel-related costs, technology, and outside services spend due to Company growth.
Q1'25 sales and marketing costs increased 43% YoY, primarily due to an increase in commissions, in line with the increase in subscription revenue, and an increase in growth media spend.
Q1'25 general and administrative expenses increased 9% YoY, primarily driven by Company growth.
Cash Flow
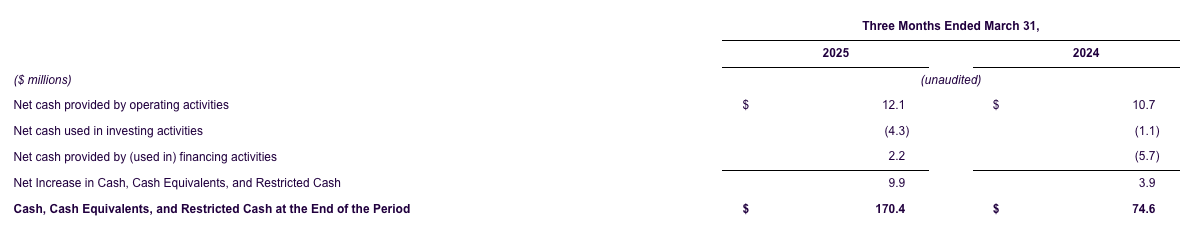
Life360 ended Q1'25 with cash, cash equivalents and restricted cash of $170.4 million, an increase of $9.9 million from Q4’24.
Q1'25 operating cash flow was $12.1 million. An additional $2.2 million was provided by financing activities, primarily from the exercise of stock options. Additionally, $4.3 million was used for investing activities, which includes a $2.8 million payment in connection with the Fantix asset acquisition and payments for internally developed software.
Q1'25 net cash provided by operating activities of $12.1 million was lower than Adjusted EBITDA of $15.9 million primarily due to the timing of receipts and payables. See the Adjusted EBITDA section below for the definition and reconciliation of Adjusted EBITDA.
Adjusted EBITDA
To supplement our condensed consolidated financial statements prepared and presented in accordance with GAAP, we use certain non-GAAP financial measures, as described below, to facilitate analysis of our financial and business trends and for internal planning and forecasting purposes. For more information, see the “Supplementary and Non-GAAP Financial Information” section below.
Note: The financial information in this announcement may not add or recalculate due to rounding. All references to $ are to U.S. dollars.
Non-GAAP financial measures include adjusted earnings before interest, taxes, depreciation and amortization (“Adjusted EBITDA”) and Adjusted EBITDA Margin. Adjusted EBITDA is defined as net income (loss), excluding (i) convertible notes and derivative liability fair value adjustments, (ii) provision for (benefit from) income taxes, (iii) depreciation and amortization, (iv) other income, net, (v) acquisition-related transaction costs, (vi) stock-based compensation, and (vii) workplace restructuring costs. These items are excluded from Adjusted EBITDA because they are non-cash in nature, because the amount and timing of these items are unpredictable, or because they are not driven by core results of operations and render comparisons with prior periods and competitors less meaningful.
The following table presents a reconciliation of Net income (loss), the most directly comparable GAAP measure, to Adjusted EBITDA:
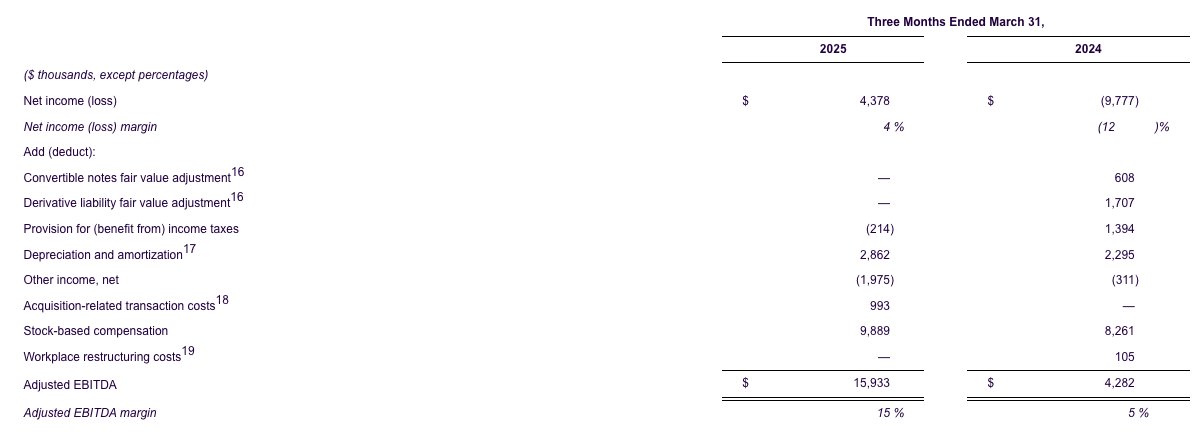
16. To reflect the change in fair value of the September 2021 Convertible Notes and derivative liability associated with the July 2021 Convertible Notes.
17. Includes depreciation on fixed assets and amortization of intangible assets.
18. Relates to costs incurred in connection with the asset acquisition of Fantix, Inc., including one-time bonus payments.
19. Relates to non-recurring personnel and severance related expenses.
Q1'25 delivered a positive Adjusted EBITDA contribution of $15.9 million versus $4.3 million in Q1’24 as a result of continued strong subscription and other revenue growth and improved operating leverage.
Note: The financial information in this announcement may not add or recalculate due to rounding. All references to $ are to U.S. dollars.
2025 Earnings Guidance (20)
For FY’25, Life360 expects to deliver the following metrics:
Consolidated revenue of $450 million - $480 million comprised of:
Subscription revenue of $355 million - $365 million;
Hardware revenue of $40 million - $50 million;
Other revenue of $55 million - $65 million; and
Positive Adjusted EBITDA (21) of $65 million - $75 million.
20. With respect to forward looking non-GAAP guidance, we are not able to reconcile the forward-looking non-GAAP adjusted EBITDA measure to the closest corresponding GAAP measure without unreasonable efforts because we are unable to predict the ultimate outcome of certain significant items, which are fluid and unpredictable in nature. In addition, the Company believes such a reconciliation would imply a degree of precision that may be confusing or misleading to investors. These items include, but are not limited to, litigation costs and fair value adjustments. These items may be material to our results calculated in accordance with GAAP.
21. Adjusted EBITDA is a non-GAAP measure. For more information, including the definition of Adjusted EBITDA, the use of this non-GAAP measure, as well as a reconciliation of Net Income (Loss) to Adjusted EBITDA, refer to the “Adjusted EBITDA” section above and the “Supplementary and Non-GAAP Financial Information” section below.
Investor Conference Call
A conference call will be held today as follows:
US PDT: Monday 12 May 2025 at 3 p.m.
US EDT: Monday 12 May 2025 at 6 p.m.
AEST: Tuesday 13 May 2025 at 8 a.m.
The call will be held as a Zoom audio webinar.
Participants wishing to ask a question should register and join via their browser here. Participants joining via telephone will be in listen only mode.
Dial in details
U.S.: +1 669 444 9171
Australia: +61 2 8015 6011
Other countries: details
Meeting ID: 994 2971 6688
A replay will be available after the call at https://investors.life360.com.
Authorization
Chris Hulls, Director, Co-Founder and Chief Executive Officer of Life360 authorized this announcement being given to ASX.
Note: The financial information in this announcement may not add or recalculate due to rounding. All references to $ are to U.S. dollars.
About Life360
Life360, a family connection and safety company, keeps people close to the ones they love. The category-leading mobile app and Tile tracking devices empower members to stay connected to the people, pets, and things they care about most, with a range of services, including location sharing, safe driver reports, and crash detection with emergency dispatch. As a remote-first company based in the San Francisco Bay Area, Life360 serves approximately 83.7 million monthly active users (MAU), as of March 31, 2025, across more than 170 countries. Life360 delivers peace of mind and enhances everyday family life in all the moments that matter, big and small. For more information, please visit life360.com.
Contacts
For U.S. investor inquiries:
Raymond (RJ) Jones
rjones@life360.com
For U.S. media inquiries:
Lynnette Bruno
press@life360.com
For Australian investor inquiries:
Jolanta Masojada
+61 417 261 367
jmasojada@life360.com
For Australian media inquiries:
Giles Rafferty
+61 481 467 903
grafferty@firstadvisers.com.au
Forward-looking statements
This announcement and the accompanying presentation and conference call contain forward-looking statements within the meaning of the Private Securities Litigation Reform Act of 1995. Life360 intends such forward-looking statements to be covered by the safe harbor provisions for forward-looking statements contained in Section 21E of the Securities Exchange Act of 1934, as amended. These forward-looking statements regarding Life360’s intentions, objectives, plans, expectations, assumptions and beliefs about future events, including Life360’s expectations with respect to the financial and operating performance of its business, including subscription revenue, hardware revenue, other revenue and consolidated revenue and ability to create new revenue streams; the resiliency of Life360’s core subscription business; the ability of Life360 to adapt to and mitigate the impact of macroeconomic considerations including tariffs and trade barriers; its ability to deliver contextually relevant advertisements that enhance the user experience by leveraging its extensive first-party location data; Adjusted EBITDA, and operating cash flow; expectations regarding MAUs and other member metrics; its capital position; future growth and market opportunities; plans to launch new features and products; the impact of price increases and expansion of product offerings in the UK, Australia and New Zealand on future results of operations; its expectations of growth in its data business; its expectation of a new enterprise revenue stream and enhanced location capabilities of its hardware devices as a result of its partnership with Hubble; its focus on developing a GPS lineup, built on Jiobit technology, the timing of new devices, and the potential for the next generation of hardware to drive a new wave of subscription growth; as well as Life360’s expectations of any changes to the information disclosed herein. The words “anticipate”, “believe”, “expect”, “project”, “predict”, “will”, “forecast”, “estimate”, “likely”, “intend”, “outlook”, “should”, “could”, “may”, “target”, “plan” and other similar expressions can generally be used to identify forward-looking statements. Indications of, and guidance or outlook on, future earnings or financial position or performance are also forward-looking statements. Investors and prospective investors are cautioned not to place undue reliance on these forward-looking statements as they involve inherent risk and uncertainty (both general and specific) and should note that they are provided as a general guide only and should not be relied on as an indication or guarantee of future performance. There is a risk that such predictions, forecasts, projections and other forward-looking statements will not be achieved. Subject to any continuing obligations under applicable law, Life360 does not undertake any obligation to publicly release the result of any revisions to these forward-looking statements to reflect events or circumstances after the date of this announcement, to reflect any change in expectations in relation to any forward-looking statements or any change in events, conditions or circumstances on which any such statements are based.
Note: The financial information in this announcement may not add or recalculate due to rounding. All references to $ are to U.S. dollars.
Although Life360 believes that the expectations reflected in the forward-looking statements and the assumptions upon which they are based are reasonable, Life360 can give no assurance that such expectations and assumptions will prove to be correct and, actual results may vary in a materially positive or negative manner. Forward-looking statements are subject to known and unknown risks, uncertainty, assumptions and contingencies, many of which are outside Life360’s control, and are based on estimates and assumptions that are subject to change and may cause actual results, performance or achievements to differ materially from those expressed or implied by such statements. Factors that could cause actual results to differ materially from those in the forward-looking statements include risks related to the preliminary nature of financial results, risks related to Life360’s business, market risks, Life360’s need for additional capital, and the risk that Life360’s products and services may not perform as expected, as described in greater detail under the heading “Risk Factors” in Life360’s ASX and SEC filings, including its Annual Report on Form 10-K filed with the Securities and Exchange Commission on February 27, 2025, Quarterly Reports on Form 10-Q, and other reports filed with the SEC. To the maximum extent permitted by law, responsibility for the accuracy or completeness of any forward-looking statements whether as a result of new information, future events or results or otherwise is disclaimed. This announcement should not be relied upon as a recommendation or forecast by Life360. Past performance information given in this document is given for illustrative purposes only and is not necessarily a guide to future performance and no representation or warranty is made by any person as to the likelihood of achievement or reasonableness of any forward-looking statements, forecast financial information, future share price performance or any underlying assumptions. Nothing contained in this document nor any information made available to you is, or shall be relied upon as, a promise, representation, warranty or guarantee as to the past, present or the future performance of Life360.
Note: The financial information in this announcement may not add or recalculate due to rounding. All references to $ are to U.S. dollars.
Note: The financial information in this announcement may not add or recalculate due to rounding. All references to $ are to U.S. dollars.
Note: The financial information in this announcement may not add or recalculate due to rounding. All references to $ are to U.S. dollars.
Note: The financial information in this announcement may not add or recalculate due to rounding. All references to $ are to U.S. dollars.
Supplementary and Non-GAAP Financial Information
We report our financial results in accordance with GAAP, however, management believes that certain non-GAAP financial measures, such as Adjusted EBITDA, and the other measures presented in the tables below provide useful information to investors and others in understanding and evaluating our results of operations, as well as providing useful measures for period-to-period comparisons of our business performance. Moreover, we have included non-GAAP financial measures in this media release because they are key measurements used by our management team internally to make operating decisions, including those related to operating expenses, evaluate performance, and perform strategic planning and annual budgeting.
Our non-GAAP financial measures are presented for supplemental informational purposes only, may not be comparable to similarly titled measures used by other companies and should not be used as substitutes for analysis of, or superior to, our operating results as reported under GAAP. Additionally, we do not consider our non-GAAP financial measures as superior to, or a substitute for, the equivalent measures calculated and presented in accordance with GAAP. As such, you should consider these non-GAAP financial measures in addition to other financial performance measures presented in accordance with GAAP, including various cash flow metrics, net loss and our other GAAP results.
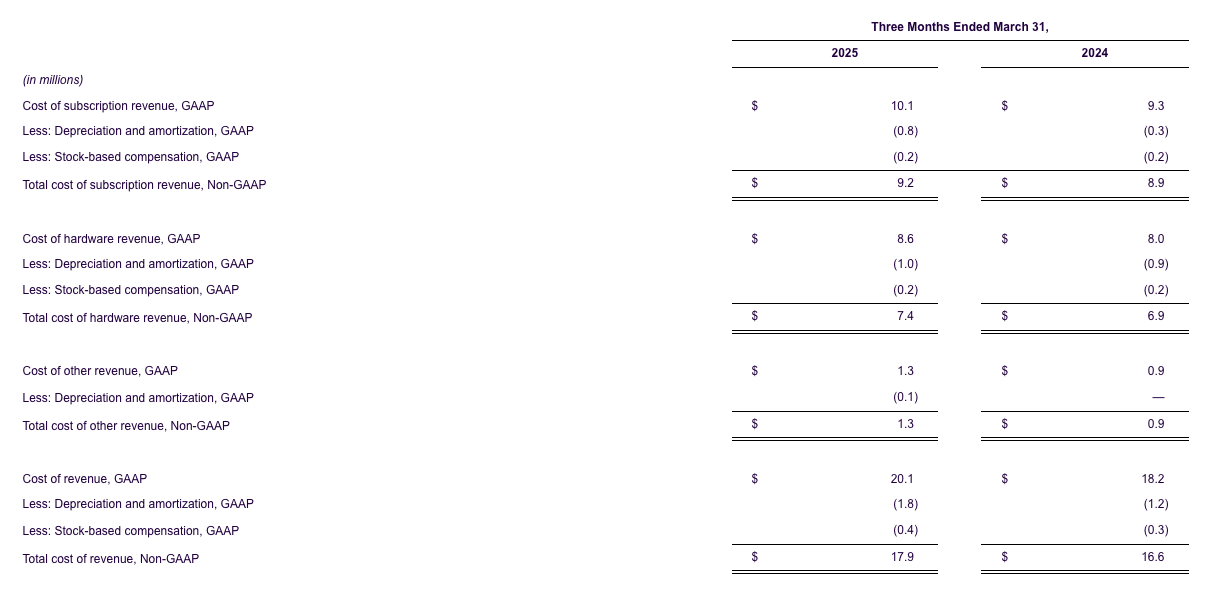
Non-GAAP cost of revenue is presented to understand margin economically and non-GAAP operating expenses are presented to understand operating efficiency. Non-GAAP cost of revenue and Non-GAAP operating expenses present direct and indirect expenses adjusted for non-cash expenses, such as stock-based compensation, depreciation and amortization, and non-recurring expenses, such as workplace restructuring costs, and acquisition-related transaction costs. A reconciliation of GAAP financial information to Non-GAAP financial information for cost of revenue and operating expenses has been provided as supplementary information below.
GAAP Cost of Revenue to Non-GAAP Cost of Revenue Reconciliation (22)
Note: The financial information in this announcement may not add or recalculate due to rounding. All references to $ are to U.S. dollars.
22. For the definition of cost of revenue, Non-GAAP, refer to the Supplementary and Non-GAAP Financial Information section above.
Note: The financial information in this announcement may not add or recalculate due to rounding. All references to $ are to U.S. dollars.
GAAP Operating expenses to Non-GAAP Operating Expenses Reconciliation (23)
23. For the definition of operating expenses, Non-GAAP, refer to the Supplementary and Non-GAAP Operating Information section above.
Note: The financial information in this announcement may not add or recalculate due to rounding. All references to $ are to U.S. dollars.