Green Means Go. Red Means…Scroll? Digital Distractions Are Steering Focus off the Road for Every Generation

From social media scrolling to text alerts, digital distractions are taking the wheel–and it’s not just Gen Z to blame. As April is National Distracted Driving Awareness Month and summer 2025 is anticipated to see nearly 200M Americans take road trips, Life360 is shining the high beams on the increase of digital distractions taking the wheel. We compiled a study analyzing over 60 billion data points of its members’ driving behaviors and surveyed another 1,000 U.S. drivers across all generations to uncover what’s really pulling attention off the road. The results found that 86% of all drivers admitted to being distracted by technology, and even older generations who once swore by “10 and 2” can’t seem to resist a scroll at stoplights.
And the impact is serious: on average, Life360 detects 2,000 collisions every day. As the leading family safety app trusted by millions, we equip families with tools to stay safer behind the wheel —from real-time location sharing to crash detection with emergency dispatch to driver safety reports— helping them navigate today’s roads with greater confidence and peace of mind.
Chaotic Commutes & High-Speed Multi-Tasking: What's Really Going on Behind the Wheel?
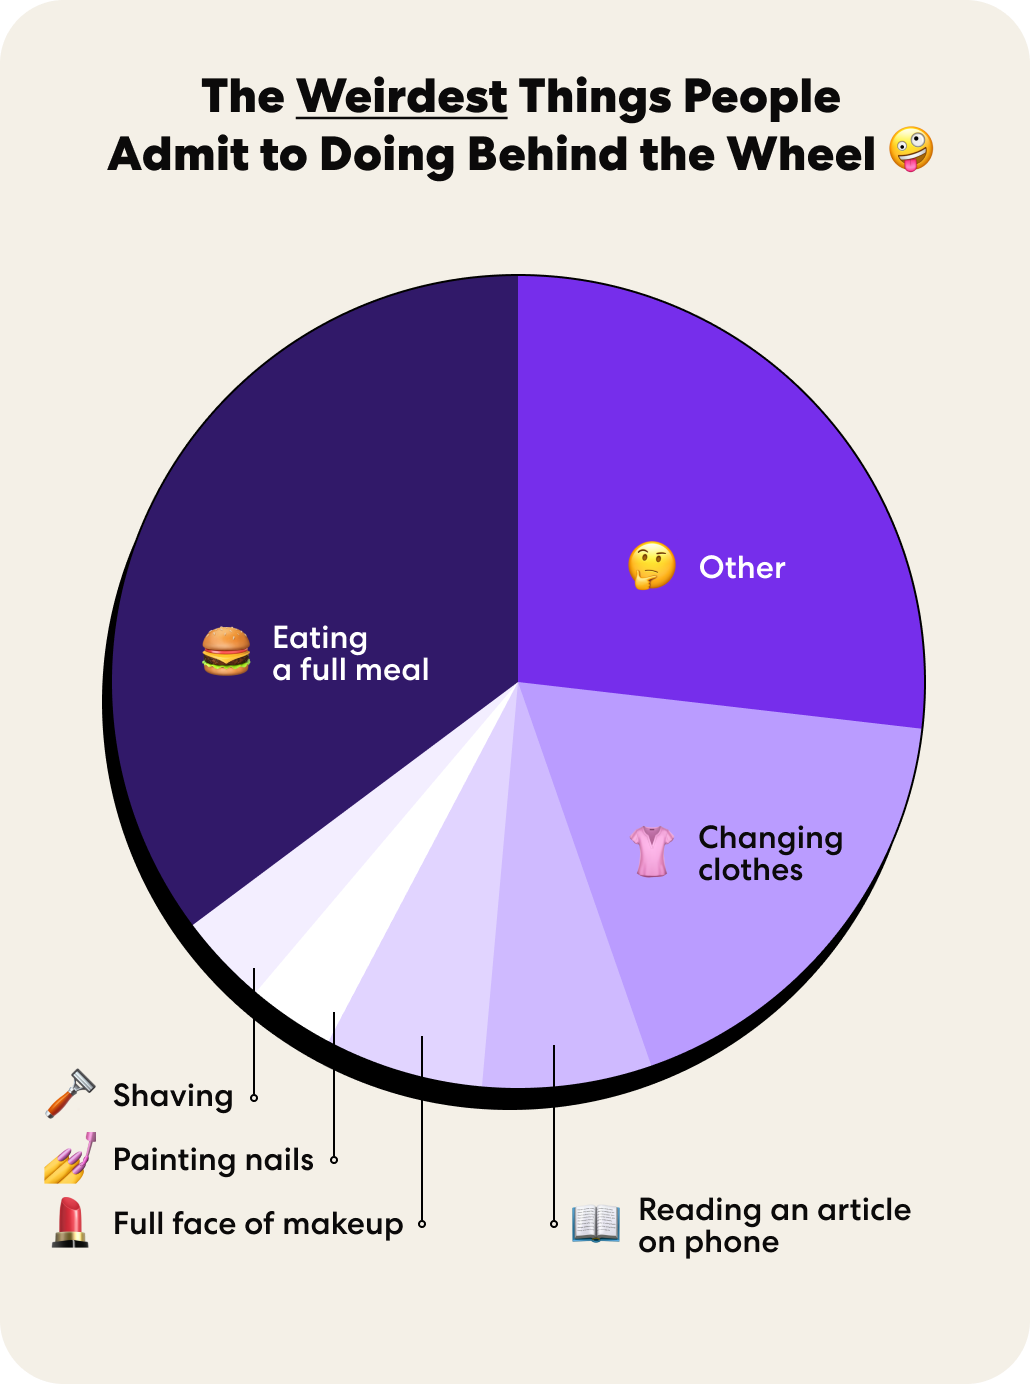
While texting is often the assumed culprit for distracted driving, the truth is drivers are going far beyond just sending the classic “OMW!” text. Our survey found some of the biggest culprits are far wilder than what you’d expect.
27% have confessed to changing outfits, shaving, putting on makeup, or even painting their nails on the road—and this increases to over 50% for Gen Z drivers
A whopping 72% of those who eat and drink while driving admit they’ve tried some seriously risky meals, like eating BBQ ribs or a bowl of hot soup
And 74% say the most embarrassing distraction of all is filming videos or creating social media content while driving
Beyond tech and tacos, emotional distractions are also driving people off course. 1 in 5 drivers say stress from work or school—or a heated exchange with a friend or partner—can mess with their focus behind the wheel. (Raise your hand if you’ve ever cried while driving home from a breakup!)
Content in the Car: Gen Z is Scrolling Toward Trouble
It’s no secret that Gen Z is chronically online—but that obsession is following them into the driver’s seat. These habits aren’t harmless—they have real consequences. Life360 data shows rapid acceleration peaks at age 18, and crash rates are highest among 17 to 20-year-olds, suggesting many young drivers may not be giving the road their full attention.
Nearly half (42%) of Gen Z drivers admit to watching online videos while driving
Over a third (37%) confess to scrolling social media while behind the wheel
So next time you reach to sneak in a “get ready with me” video while merging onto the highway—maybe…don’t?
Road Rage Against Age: The Generational Blame Game
Which generation represents the riskiest drivers? It depends on who you ask. Over half (57%) of all drivers blame Gen Z for being the most distracted generation on the road. But (no shocker here) Gen Z drivers disagree–in fact, 54% of them point the finger at Baby Boomers, claiming they are the real culprits behind the wheel.
Who’s right? This is what the data confirms:
Turns out, the majority may be onto something — Gen Z drivers (ages 15–28) speed 84% more often than Baby Boomers. The peak in both speeding and rapid acceleration happens right around age 20.
But inside the family Circle, Dad might be the biggest offender. Our data reveals that dads consistently top the charts for speeding—clocking in 15% more often than moms.
And across the board, tech is taking the wheel. More than half of Millennials and over a quarter of Gen X admit to texting while driving.
Where Are We Driving the Most Distracted? Some Regions are Riskier than Others.
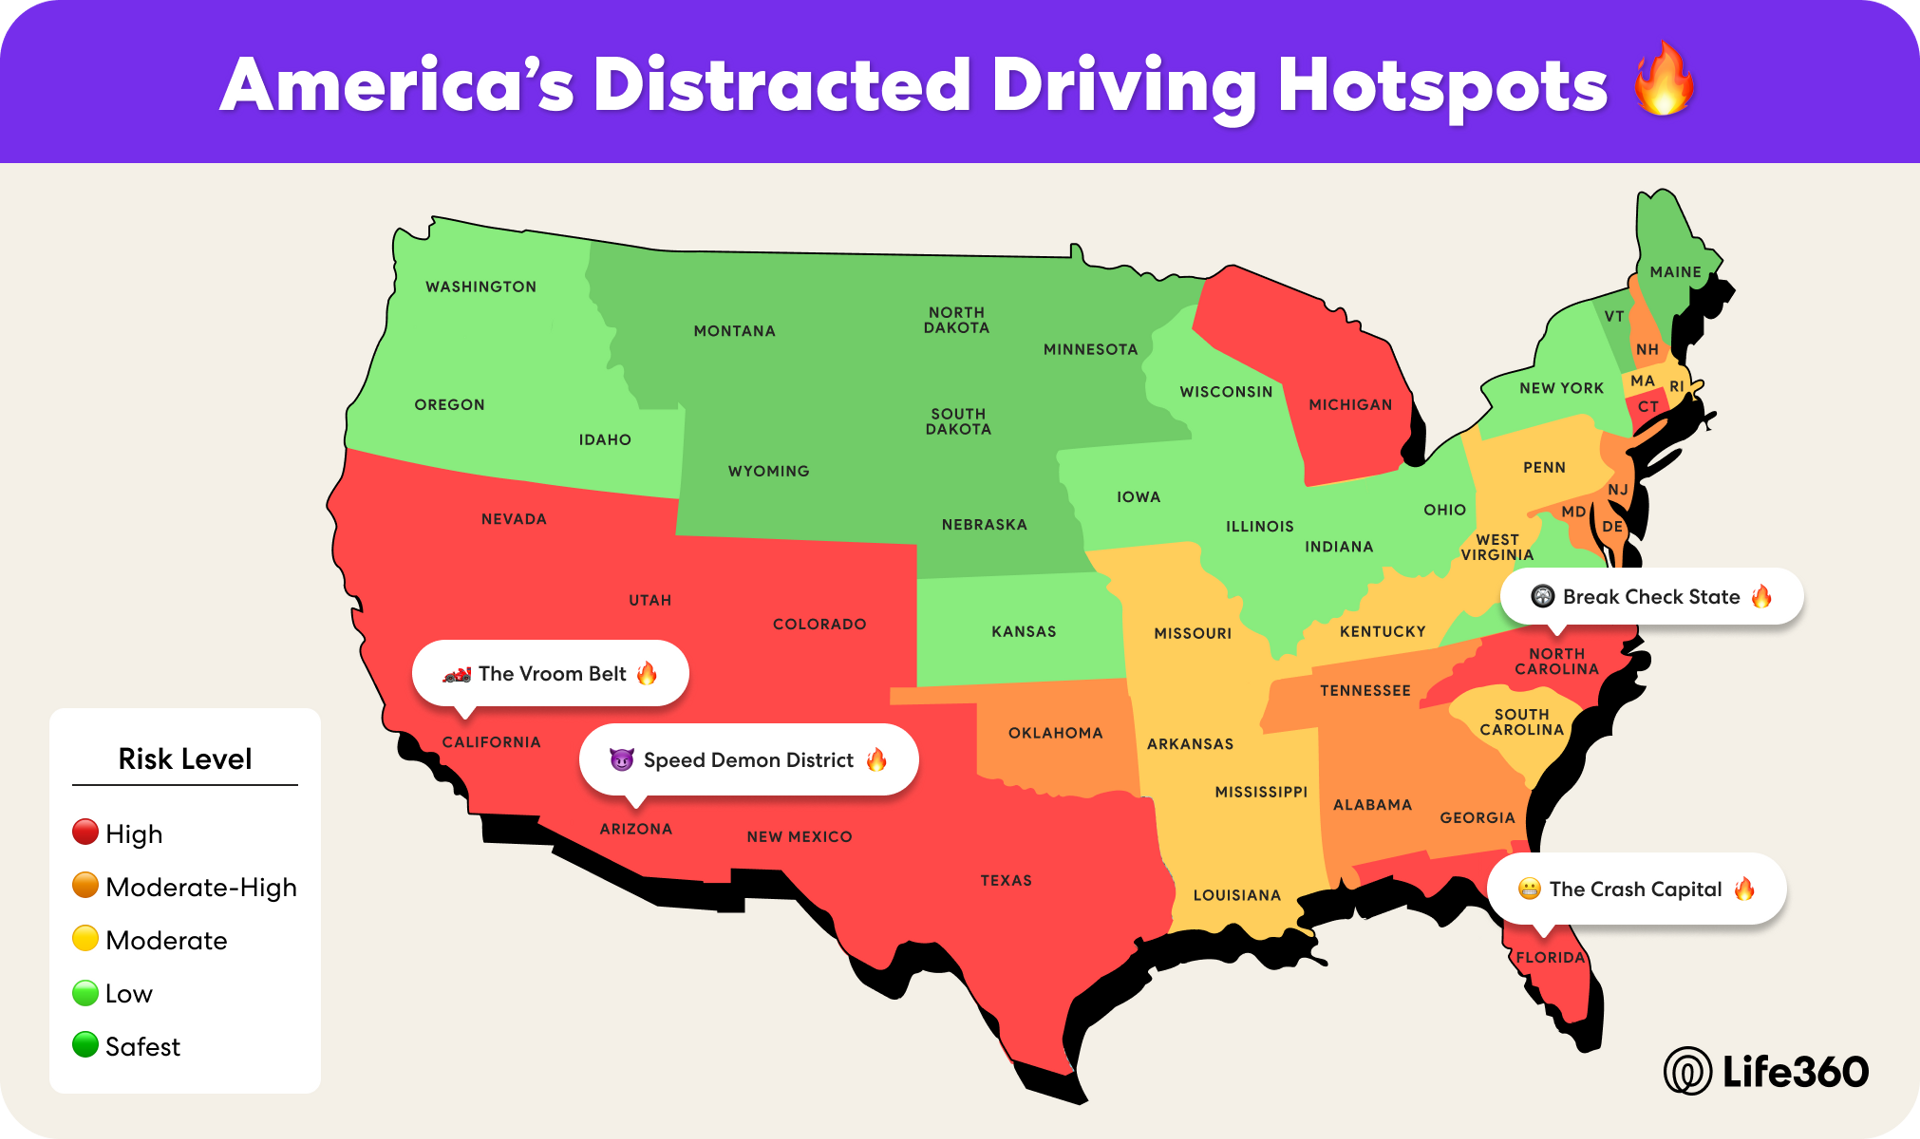
Distracted driving might be a national problem, but some places are far more dangerous than others. Life360’s internal driving data reveals where aggressive and risky behaviors behind the wheel are happening most often—specifically tracking four key indicators: crashes, speeding, hard braking, and rapid acceleration.
A state-by-state heat map reveals alarming distracted driving trends in regions across the US, and the results may surprise you. Our data shows that the South and West are consistent hotspots for dangerous driving behaviors with the following states leading the nation in risky driving habits:
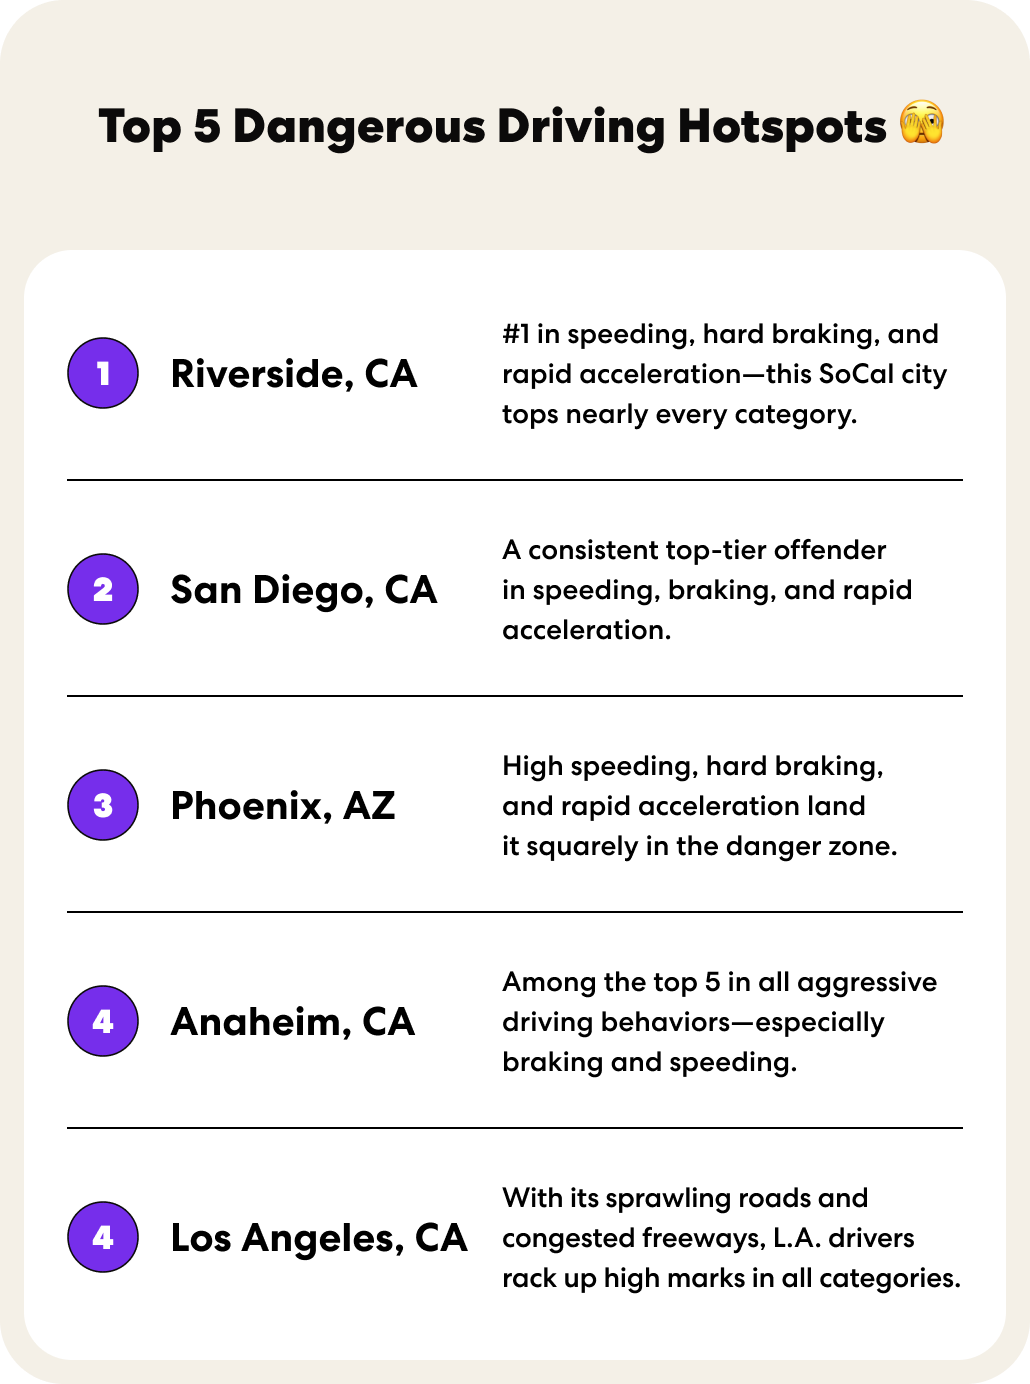
California may be the epicenter of aggressive driving. It tops the nation in rapid acceleration and is home to cities like Riverside, San Diego, Anaheim, and Los Angeles—all ranking among the top five worst offenders for rapid acceleration, hard braking, and speeding.
Florida has the highest percentage of crashes of any state in the country, with frequent rapid acceleration and hard braking to match. Tampa, Orlando, Miami, Jacksonville, and Fort Lauderdale make up five of the eight highest crash cities in America.
Arizona tops the nation in speeding and ranks among the highest for hard braking and rapid acceleration—on both urban highways and rural roads.
North Carolina drivers are hitting the brakes—hard. The state ranks #1 for hard braking and #2 for crashes, making it one of the riskiest places to be on the road.
If you’re driving in one of these major metro areas, you might want to buckle up–literally and figuratively. Drivers in these cities consistently engage in risky behaviors, making them some of the most dangerous places to drive:
So, How Do We Drive Smarter? Let’s Shift Gears with Life360.
The data is clear: distracted driving isn’t just a Gen Z problem—it’s an everyone-with-a-phone problem. Safer roads start with awareness, accountability, and the right tools. For families with teen drivers, Life360’s Driving Reports and Alerts can be a powerful teaching tool, helping parents and teens have real conversations about speed, phone use, and driving habits. And when things don’t go as planned, our Crash Detection and Roadside Assistance provides a crucial safety net, giving families peace of mind when they need it most.
Eyes up, phones down— let’s build better driving habits together.
Life360 Methodology:
Internal Life360 driving data is derived from 60 billion proprietary data points collected across over 55 million opted-in users. The analysis focused on four core behavior indicators: crashes, speeding, hard braking, and rapid acceleration. All data was analyzed in aggregate and normalized on a per-trip basis to determine region- and demographic-specific risk patterns. The data reflects activity from 1/1/24-4/9/25. Major cities are defined as those with over 100 million recorded trips during the analysis period.
Crashes: Detected using patented Crash Detection technology, which relies on a phone’s built-in sensors—like the accelerometer and GPS—to identify major collisions. A crash is recorded when a significant impact occurs while the vehicle is moving at speeds over 25 mph.
Extensive Speeding: Flagged when a user is traveling over 80 mph for at least 30 seconds, a threshold that reflects high-risk, excessive speeding.
Hard Braking: Occurs when a vehicle decelerates sharply, defined as a slowdown of approximately 8 mph or more within one second.
Rapid Acceleration: Logged when a car’s speed increases by about 8 mph or more in one second, a common sign of aggressive driving.
Survey Methodology:
This sample of 1,000 U.S. drivers (aged 16 - 65) was surveyed between March 18, 2025 and March 20, 2025. All respondents are currently active, licensed drivers, confirmed by respondent self-confirmation. DKC Analytics conducted and analyzed this survey with a sample procured using the Pollfish survey delivery platform, which delivers online surveys globally through mobile apps and the mobile web along with the desktop web. No post-stratification has been applied to the results.