Life360 reports Q2 and Half Year 2022 results
Continued strong Life360 user and subscriber YoY momentum with Monthly Active Users (MAU) up 29%, Paying Circles up 41%.
H1 subscription revenue up 90%, and 60% for core Life360 subscriptions
Platform established for bundled hardware launch, with initial rollout matching very encouraging earlier test results
Continued expectation for sustainable positive cash flow in late CY23, and first full year of positive cash flow in CY24; CY22 H1 Adjusted EBITDA and cash burn on track
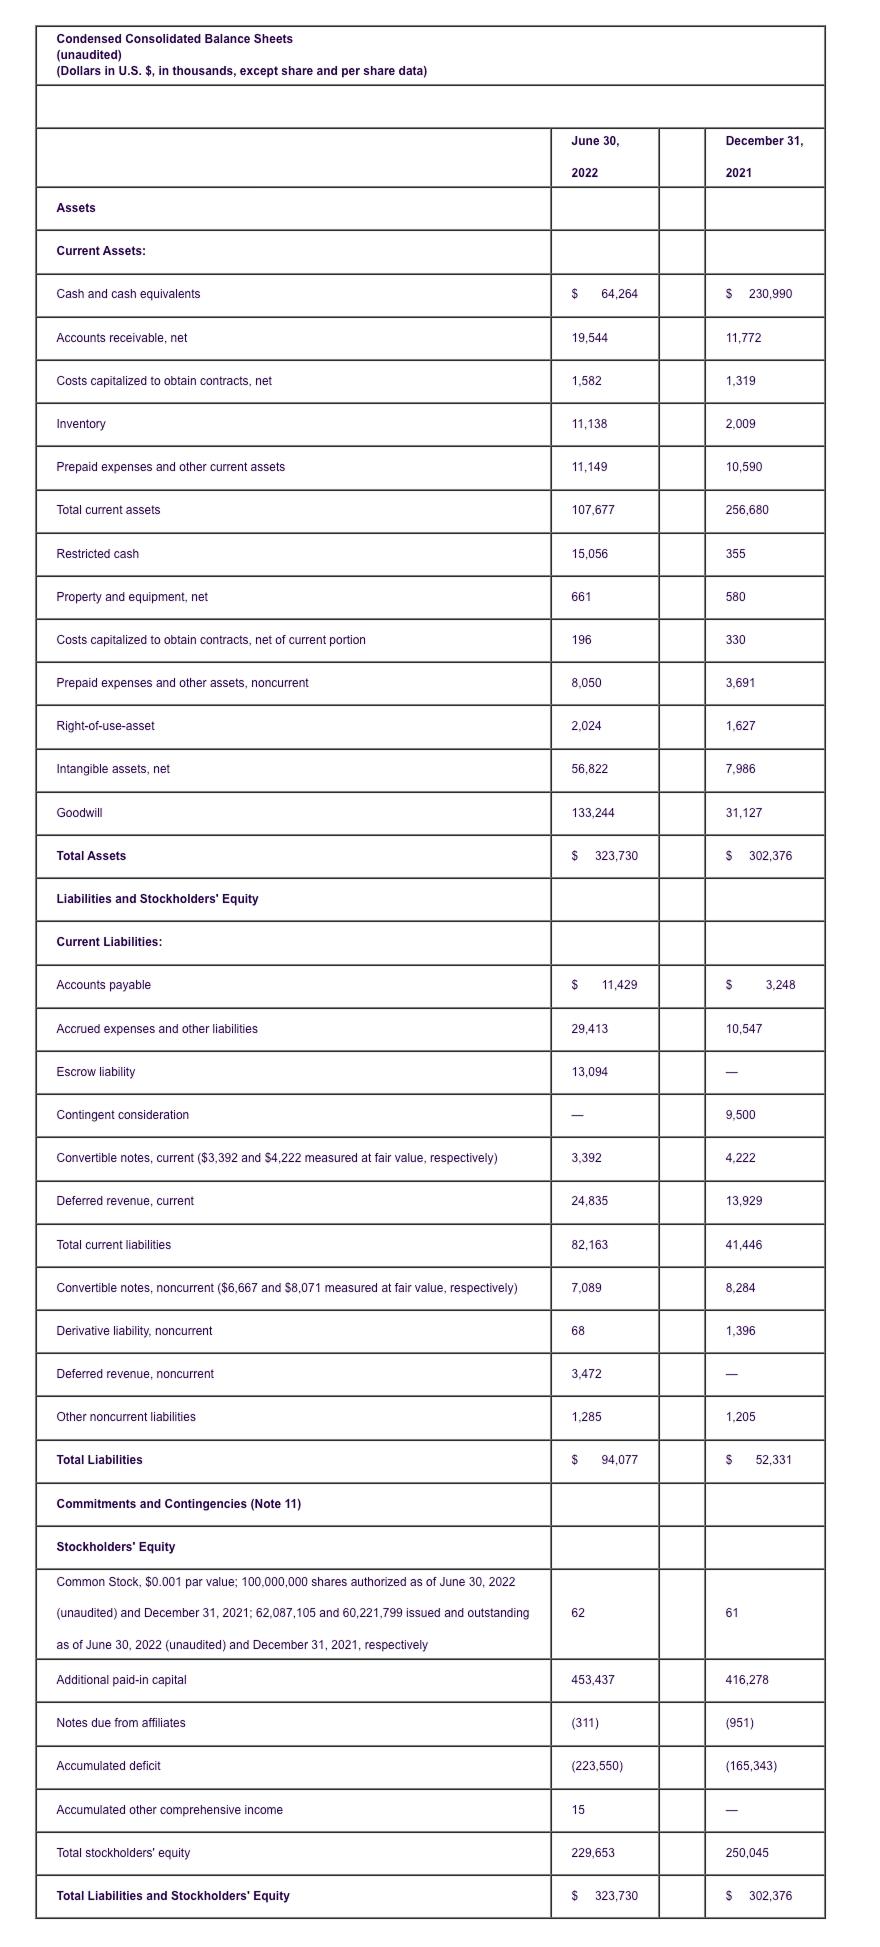
Quarter end cash, cash equivalents and restricted cash of $79.3 million
SAN FRANCISCO, Aug. 15, 2022 /PRNewswire/ — San Francisco-based Life360, Inc. (Life360 or the Company) (ASX: 360) today reported financial results for the three months and six months ended 30 June 2022 (unaudited).
Life360 Chief Executive Officer Chris Hulls said: “Life360’s significant business momentum continued in the June 2022 quarter, with net subscriber additions of 111,000, the second highest ever quarterly growth and Monthly Active Users continuing to reach new heights. Annualised Monthly Revenue (excluding hardware) of $174 million is a 65% year-on-year uplift.
“We are seeing resilience from our subscribers and users in the face of more challenging global macroeconomic circumstances, with our usual ‘back-to-school’ seasonal uplift underway. While we continue to monitor global macroeconomic conditions, in fact we continue to see strong growth in our user and subscriber performance, and maintain confidence in a very promising outlook. With the increasing value of our Membership offering, we are currently market testing higher price points. Although early, the results demonstrate the value of our services and significant pricing power. We are exploring price increases as part of our overall strategy of expanding Membership with hardware devices.
“Our unified platform has been established to launch our bundled hardware Membership offering with the initial rollout matching our very encouraging earlier trial results which delivered a 35% uplift in subscriptions versus the control group.
“As expected, CY22 H1 was a peak period for investment as we rapidly integrated core Life360 with the Tile and Jiobit acquisitions. We expect significantly lower operating losses and cash burn in H2 as we benefit from the early results from the bundled Membership offer, and Tile’s usual strong Q4 seasonality. In addition, we expect cost efficiencies arising from the integration, with ~$11m of annualised costs savings expected in H2. Our confidence in a trajectory to Adjusted EBITDA profitability and positive cash flow for CY24 is underpinned by the considerable conversion, upsell and retention upside from bundled Membership, our leaner organisational structure, and outlook for lower subscriber commissions based on out of app purchases.”
1 Numbers may not add or recalculate due to rounding
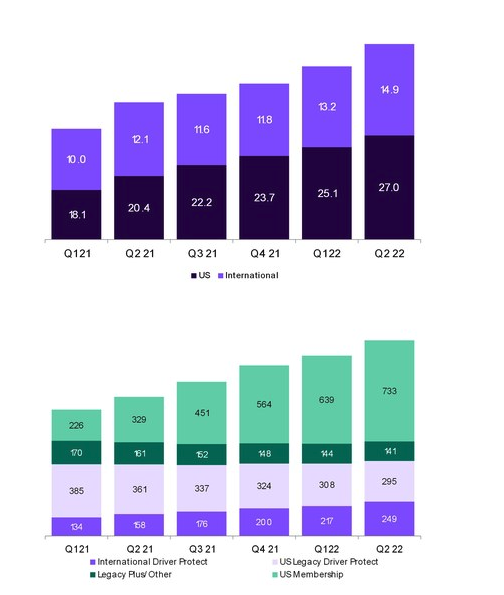
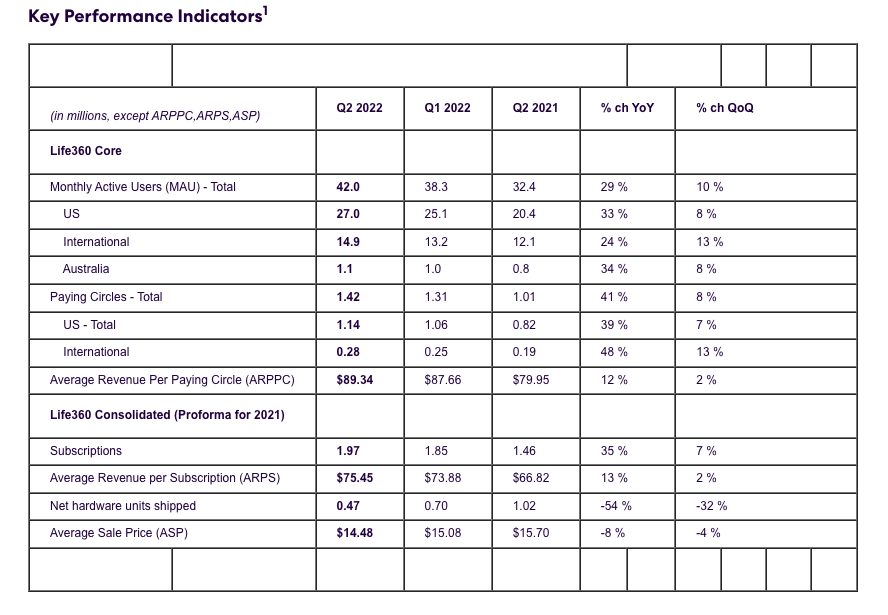
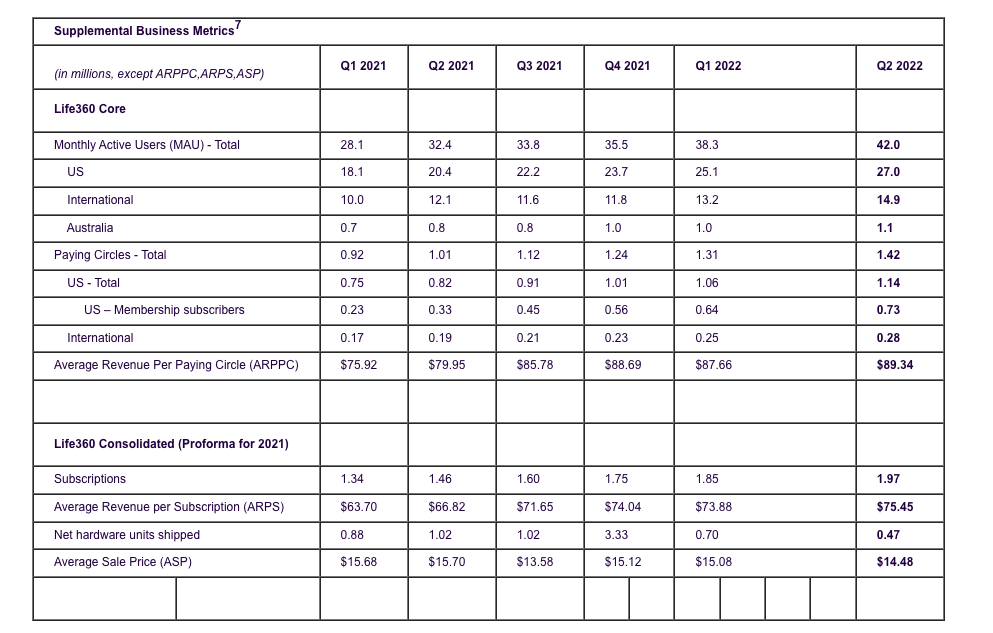
MAU increased 29% YoY to 42.0 million, with particularly strong growth in the US which delivered a 33% YoY uplift. Growth has been supported by continued investment in the free user experience which is driving higher retention and increased engagement.
Paying Circles delivered continued strong momentum up 41% YoY, with net additions of 111,000 our second highest quarterly growth on record, in a traditionally slower seasonal quarter.
US Paying Circles increased 39% year-on-year, with cumulative new and upsell subscribers in the Membership plans of 733,000, up 123%, comprising Silver (10%), Gold (84%) and Platinum (6%). Membership now makes up 64% of US Paying Circles.
Average Revenue Per Paying Circle delivered ongoing momentum, lifting 12% year-on-year.
Net Hardware units reduced reflecting the timing of returns as part of a deliberate strategy to right-size channel inventory ahead of the holiday season, and a move out of less profitable sales channels against the backdrop of the weaker consumer electronics category. We are repositioning inventory for joint Tile/Life360 retail campaigns in the holiday period, and focussing on the primary strategy of bundling with subscription.
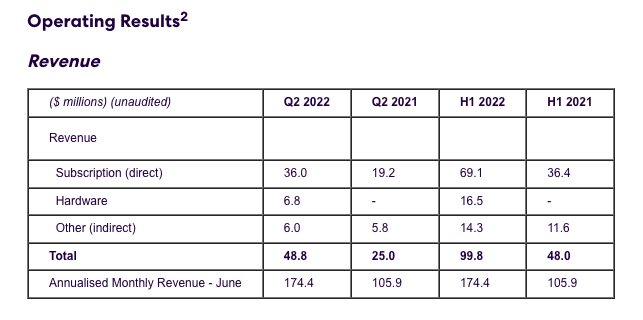
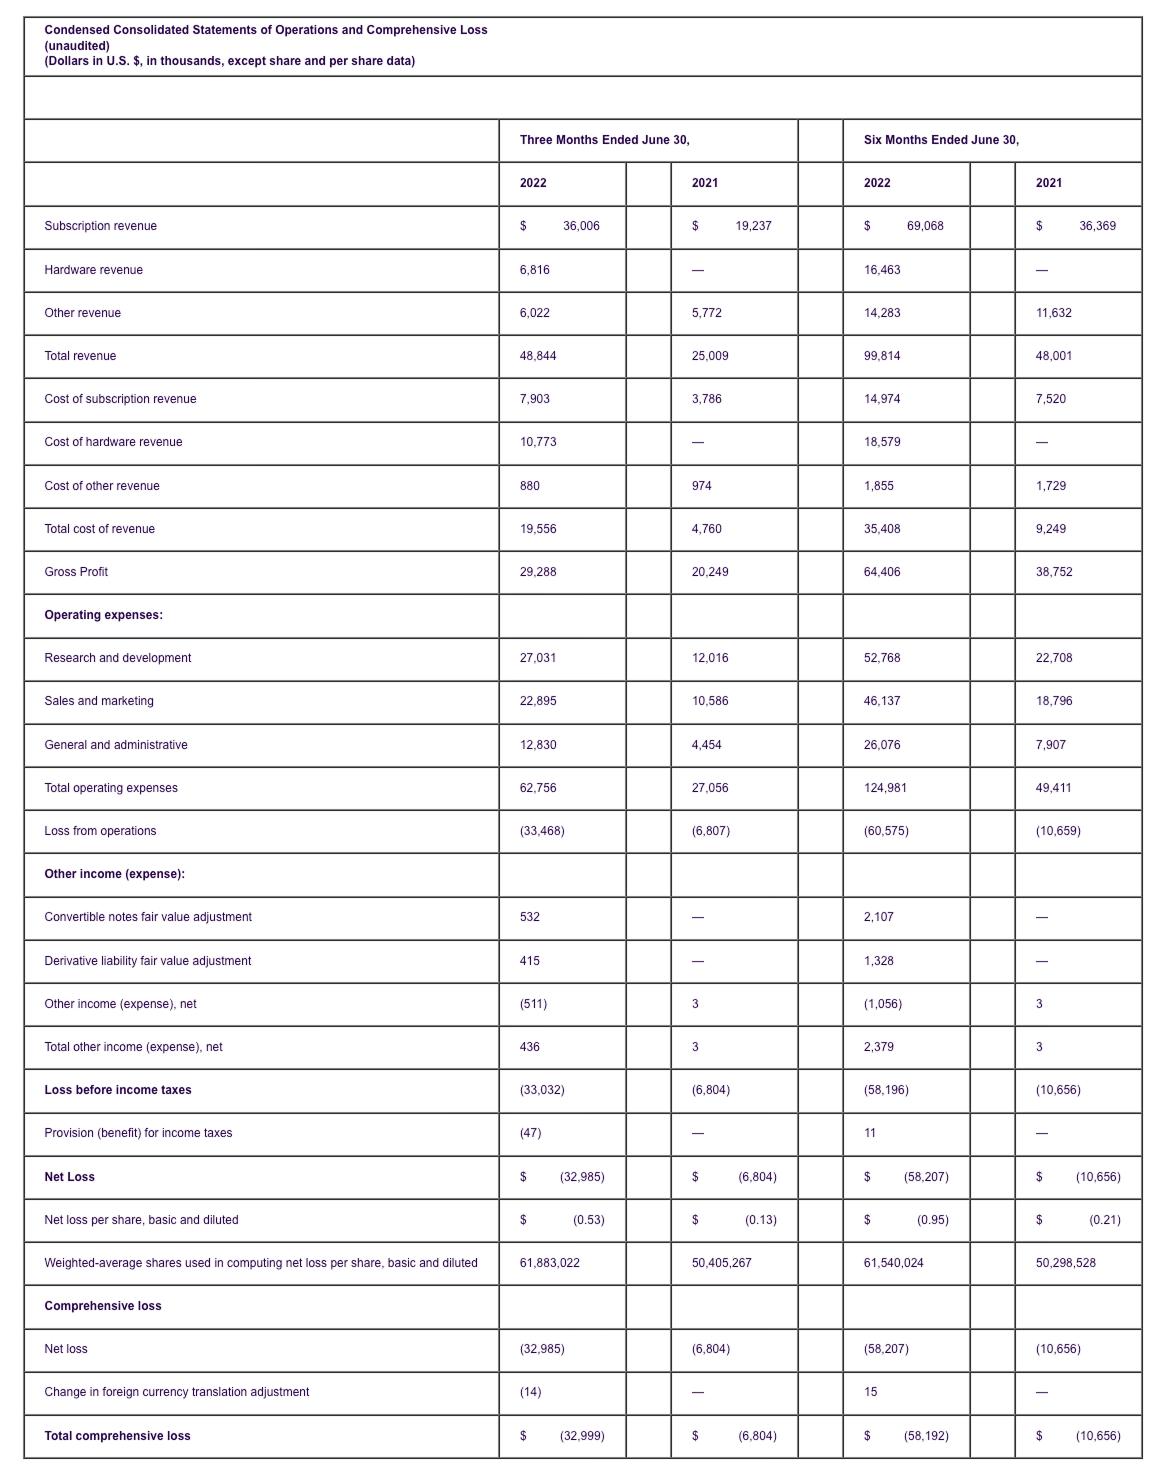
Q2 ’22 subscription revenue up 88% YoY (including Tile and Jiobit). Life360 subscription revenue increased 57% YoY benefiting from strong growth in Paying Circles and 12% uplift in Average Revenue Per Paying Circle.
Hardware revenue impacted by a deliberate strategic shift to prioritize higher margin sales channels, clear channel inventory to manage risk and prioritize inventory for bundled membership distribution against a backdrop of broad softness in the consumer electronics category.
Q2 ’22 other revenue was stable due to the transition to new data arrangement with Placer.ai.
June Annualised Monthly Revenue increased 65% year-on-year reflecting strong subscription performance and the addition of Tile and Jiobit subscription revenue.
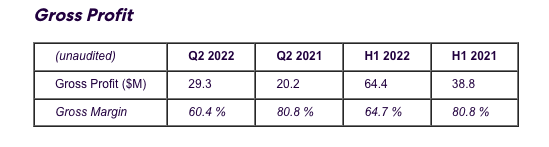
Gross profit margin reduced versus prior period reflecting the Tile and Jiobit acquisitions, and hardware’s traditionally lower gross margins. Excluding hardware, gross margins were stable at 80%.
2 Numbers may not add or recalculate due to rounding
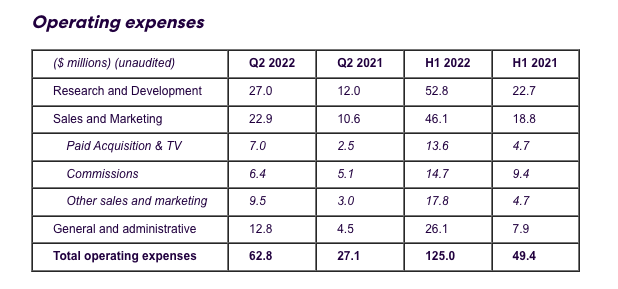
Operating expense growth reflects the acquisitions of Tile and Jiobit, with incremental investment of ~$13 million to accelerate integration of the Life360, Tile and Jiobit businesses.
Investment undertaken to establish the platform to support the rollout of the bundled Membership offering.
Cost efficiencies already realised from the leaner organisational structure expected to deliver CY22 H2 annualised cost savings of ~$11 million, with full benefit realized in CY23.
Subscriber commissions expected to reduce over time. We have been notified that Android Gold and Platinum memberships will be exempt from in-app billing, and the trend of in-app billing exemptions is expected to expand further and contribute to margin expansion.
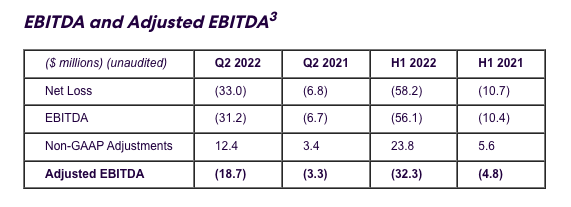
H1’22 Adjusted EBITDA loss of $32.3 million due to peak period of investment ahead of the Life360 and Tile bundled launch and the seasonality of Tile’s quarterly contribution.
H2 Adjusted EBITDA loss expected to reduce to $(3)-(6) million reflecting early benefits from the bundled Membership launch, back-to-school seasonal uplift in subscriptions, Q4 seasonal uplift in Tile revenue and profitability, organisational cost efficiencies and highly targeted growth investment.
3 EBITDA and Adjusted EBITDA are non-GAAP measures. For definitions of EBITDA and Adjusted EBITDA and the use of these non-GAAP measures, as well as a reconciliation of Net Loss to EBITDA and Adjusted EBITDA see pages 6-8
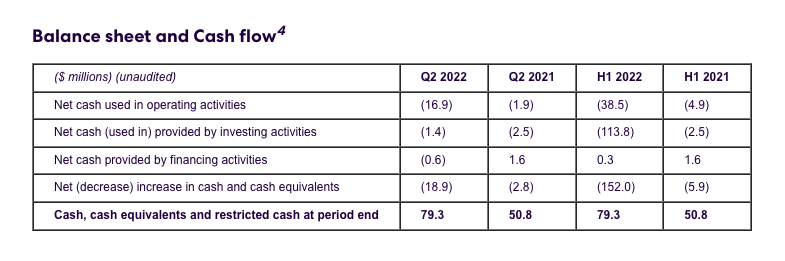
Life360 ended June 2022 with cash, cash equivalents and restricted cash of $79.3 million
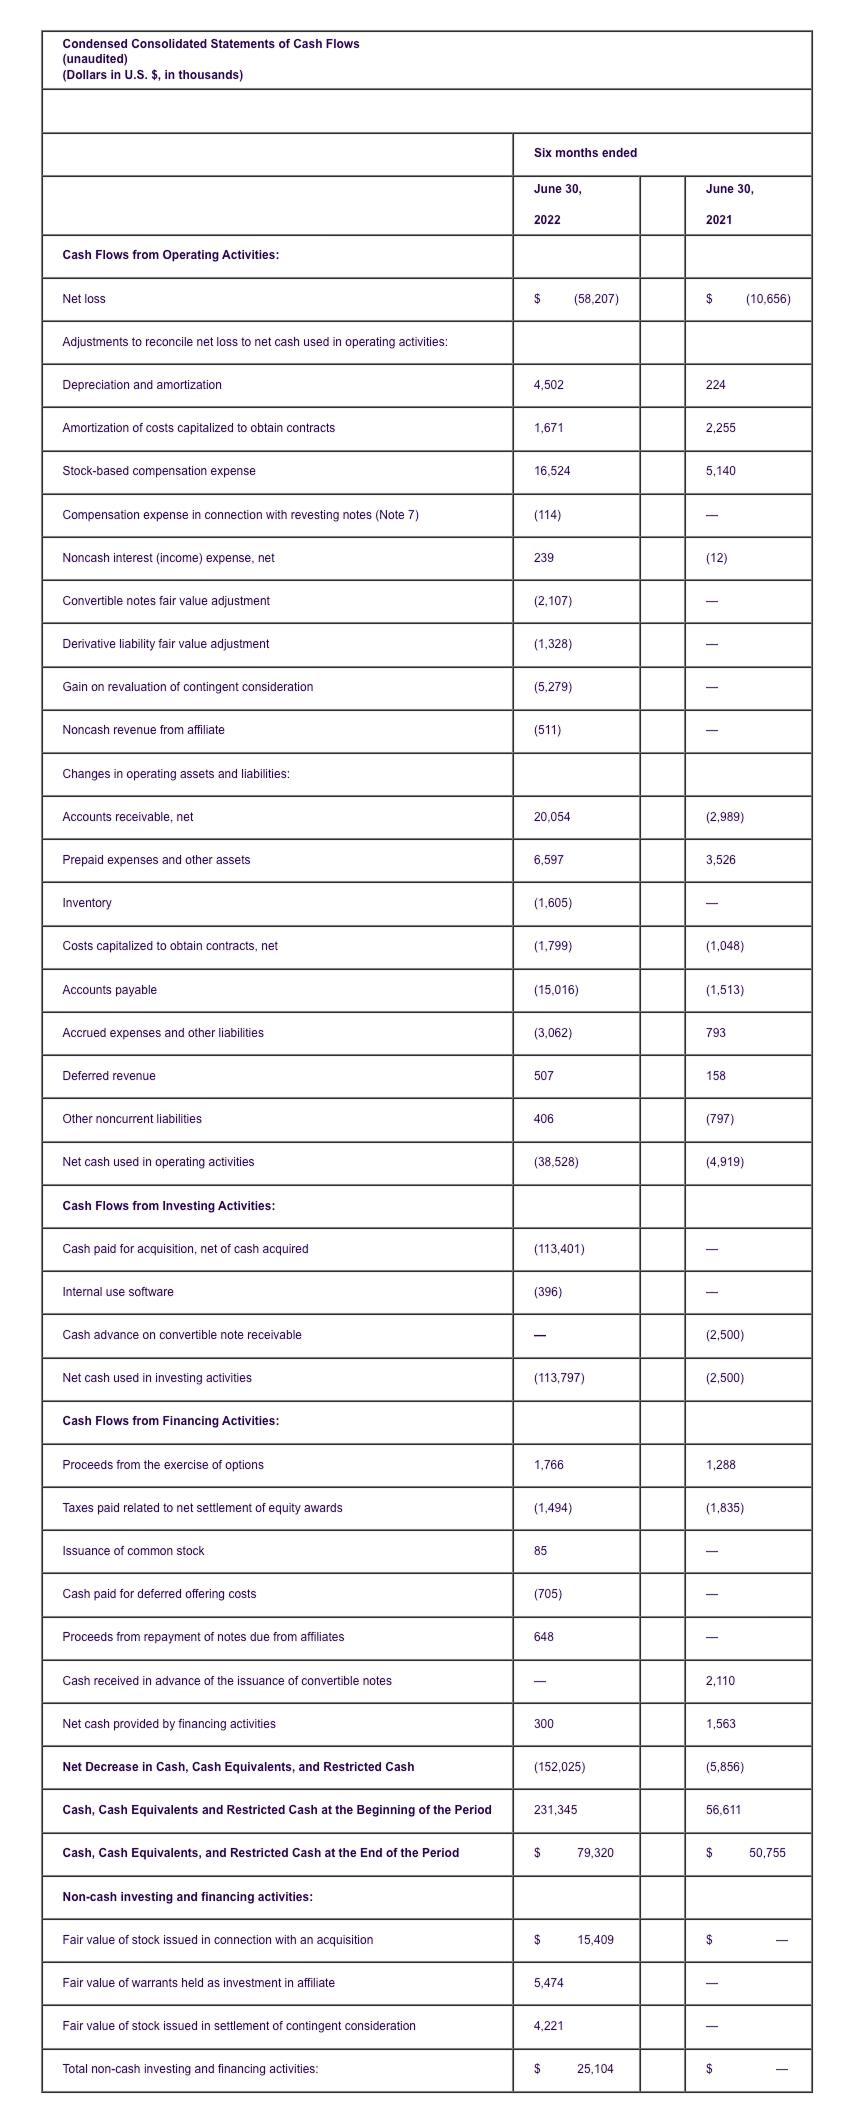
H2’22 net cash used in operating activities of $(38.5) million reflects the significant seasonality of Tile’s hardware business and transaction costs. Tile hardware sales are weighted towards the second half and the peak Q4 holiday season when Tile has historically delivered strong positive cash flow.
H1’22 cash used in investing activities of $(113.8) million reflects the timing of the Tile acquisition.
H1’22 cash received from financing activities of $0.3 million reflects proceeds from the exercise of options and settlement of RSUs.
Life360 expects to reduce cash burn in Q3 and deliver positive cash flow in Q4.
4 Numbers may not add or recalculate due to rounding
Earnings Guidance5
As previously indicated, CY22 H1 was a period of significant investment. Life360 expects to start realizing the benefits of integration in H2, as we launch the bundled Membership offering, and see an uplift in hardware in the seasonally higher holiday period in Q4. As a result, CY22 H2 is expected to see considerably lower cash burn, and a much lower Adjusted EBITDA6 loss.
For CY22 Life360 expects to deliver:
Core Life360 subscription revenue (excluding Tile and Jiobit) growth in excess of 55%;
Consolidated revenue of US$245 – 260 million for subscription (direct), hardware and other (indirect) revenue;
Adjusted EBITDA6 loss in the range of US$(35)-(38) million. This includes efficiencies flowing in H2 from the Tile integration and restructuring.
We have upgraded our guidance for Life360 subscription revenue growth, and narrowed the range for Consolidated Revenue and Adjusted EBITDA.
Life360 expects to finish CY22 with cash and cash equivalents of approximately $65 million.
We expect Life360 to be on a trajectory to consistently positive Adjusted EBITDA and Operating Cash Flow by late CY23, such that we record positive Adjusted EBITDA and Operating Cash Flow for CY24. This trajectory could be further assisted by the positive impact of potential future price changes.
5 In regards to forward looking non-GAAP guidance, we are not able to reconcile the forward-looking non-GAAP Adjusted EBITDA measure to the closest corresponding GAAP measure without unreasonable efforts because we are unable to predict the ultimate outcome of certain significant items. These items include, but are not limited to, litigation costs, convertible notes and derivative liability fair value adjustments, and gain on revaluation of contingent consideration.
6 Adjusted EBITDA was previously referred to as Underlying EBITDA. For definitions of EBITDA and Adjusted EBITDA and the use of these non-GAAP measures, as well as a reconciliation of Net Loss to EBITDA and Adjusted EBITDA see pages 6-8.
Investor Conference Call
A conference call will be held today at 9.30am AEST, Tuesday 16 August 2022 (Monday 15 August 2022 US PT at 4.30pm). The call will be held as a Zoom audio webinar.
Participants wishing to ask a question should register and join via their browser here
Participants joining via telephone will be in a listen only mode.
Dial in details
Australia : +61 2 8015 6011
US : +1 669 900 6833
Other countries : details
Meeting ID : 946 2708 7392
A replay will be available after the call at https://investors.life360.com
Authorisation
Chris Hulls, Director, Co-Founder and Chief Executive Officer of Life360 authorised this announcement being given to ASX.
About Life360
Life360 operates a platform for today's busy families, bringing them closer together by helping them better know, communicate with and protect the people they care about most. The Company's core offering, the Life360 mobile app, is a market leading app for families, with features that range from communications to driving safety and location sharing. Life360 is based in San Francisco and had 42 million monthly active users (MAU) as at June 2022, located in more than 150 countries.
Contacts
For Australian investor enquiries:
Jolanta Masojada, +61 417 261 367
For Australian media enquiries:
Giles Rafferty, +61 481 467 903
grafferty@firstadvisers.com.au
For U.S. investors
For US media enquiries:
Life360’s CDIs are issued in reliance on the exemption from registration contained in Regulation S of the US Securities Act of 1933 (Securities Act) for offers of securities which are made outside the US. Accordingly, the CDIs, have not been, and will not be, registered under the Securities Act or the laws of any state or other jurisdiction in the US. As a result of relying on the Regulation S exemption, the CDIs are ‘restricted securities’ under Rule 144 of the Securities Act. This means that you are unable to sell the CDIs into the US or to a US person who is not a QIB for the foreseeable future except in very limited circumstances until after the end of the restricted period, unless the re-sale of the CDIs is registered under the Securities Act or an exemption is available. To enforce the above transfer restrictions, all CDIs issued bear a FOR Financial Product designation on the ASX. This designation restricts any CDIs from being sold on ASX to US persons excluding QIBs. However, you are still able to freely transfer your CDIs on ASX to any person other than a US person who is not a QIB. In addition, hedging transactions with regard to the CDIs may only be conducted in accordance with the Securities Act.
Future performance and forward-looking statements
This announcement contains forward-looking statements within the meaning of the Private Securities Litigation Reform Act of 1995. Life360 intends such forward-looking statements to be covered by the safe harbor provisions for forward-looking statements contained in Section 21E of the Securities Exchange Act of 1934, as amended. These forward-looking statements can be about future events, including statements regarding Life360’s intentions, objectives, plans, expectations, assumptions and beliefs about future events, including Life360’s expectations with respect to the financial and operating performance of its business, its capital position, future growth,and its integration of Tile and Jiobit. The words “anticipate, “believe”, “expect”, “project”, “predict”, “will”, “forecast”, “estimate”, “likely”, “intend”, “outlook”, “should”, “could”, “may”, “target”, “plan” and other similar expressions can generally be used to identify forward-looking statements. Indications of, and guidance or outlook on, future earnings or financial position or performance are also forward-looking statements. Investors and prospective investors are cautioned not to place undue reliance on these forward-looking statements as they involve inherent risk and uncertainty (both general and specific) and should note that they are provided as a general guide only. There is a risk that such predictions, forecasts, projections and other forward-looking statements will not be achieved. Subject to any continuing obligations under applicable law, Life360 does not undertake any obligation to publicly release the result of any revisions to these forward-looking statements to reflect events or circumstances after the date of this announcement, to reflect any change in expectations in relation to any forward-looking statements or any change in events, conditions or circumstances on which any such statements are based. While due care has been used in the preparation of forecast information, actual results may vary in a materially positive or negative manner. Forward-looking statements are provided as a general guide only and should not be relied on as an indication or guarantee of future performance. They are subject to known and unknown risks, uncertainty, assumptions and contingencies, many of which are outside Life360’s control, and are based on estimates and assumptions that are subject to change and may cause actual results, performance or achievements to differ materially from those expressed or implied by such statements. Factors that could cause actual results to differ materially from those in the forward-looking statements include risks described in the Company’s ASX filings, Form 10 Registration Statement and subsequent reports filed with the Securities and Exchange Commission. To the maximum extent permitted by law, responsibility for the accuracy or completeness of any forward-looking statements whether as a result of new information, future events or results or otherwise is disclaimed. This announcement should not be relied upon as a recommendation or forecast by Life360. Past performance information given in this document is given for illustrative purposes only and is not necessarily a guide to future performance and no representation or warranty is made by any person as to the likelihood of achievement or reasonableness of any forward-looking statements, forecast financial information, future share price performance or any underlying assumptions. Nothing contained in this document nor any information made available to you is, or shall be relied upon as, a promise, representation, warranty or guarantee as to the past, present or the future performance of Life360.
7 Numbers may not add or recalculate due to rounding
Non-GAAP Financial Measures
We collect and analyze operating and financial data to evaluate the health of our business, allocate our resources and assess our performance.
EBITDA and Adjusted EBITDA
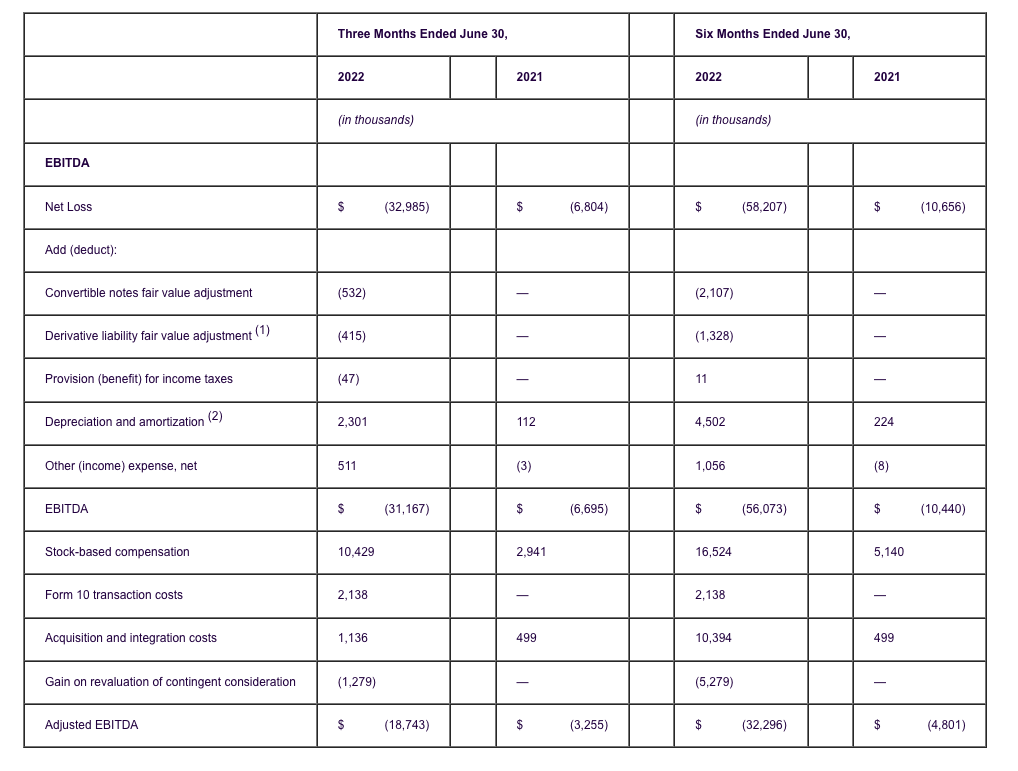
In addition to total revenue, net loss and other results under GAAP, we utilize non-GAAP calculations of earnings before interest, taxes, depreciation and amortization (“EBITDA”) and adjusted earnings before interest, taxes, depreciation and amortization (“Adjusted EBITDA”). EBITDA is defined as Net loss, excluding (i) convertible notes and derivative liability fair value adjustments, (ii) provision (benefit) for income taxes, (iii) depreciation and amortization, (iv) other income (expense). Adjusted EBITDA is defined as Net Loss, excluding (i) convertible notes and derivative liability fair value adjustments, (ii) provision (benefit) for income taxes, (iii) depreciation and amortization, (iv) other income (expense), (v) stock-based compensation, (vi) Form 10 transaction costs, (vii) acquisition and integration costs, and (viii) gain on revaluation of contingent consideration.
The above items are excluded from Adjusted EBITDA because these items are non-cash in nature, or because the amount and timing of these items are unpredictable, are not driven by core results of operations and render comparisons with prior periods and competitors less meaningful. We believe EBITDA and Adjusted EBITDA provide useful information to investors and others in understanding and evaluating our results of operations, as well as providing useful measures for period-to-period comparisons of our business performance. Moreover, we have included EBITDA and Adjusted EBITDA in this Quarterly Report on Form 10-Q because they are key measurements used by our management team internally to make operating decisions, including those related to operating expenses, evaluate performance, and perform strategic planning and annual budgeting. However, these non-GAAP financial measures are presented for supplemental informational purposes only, should not be considered a substitute for or superior to financial information presented in accordance with GAAP, and may be different from similarly titled non-GAAP financial measures used by other companies. As such, you should consider these non-GAAP financial measures in addition to other financial performance measures presented in accordance with GAAP, including various cash flow metrics, net loss and our other GAAP results.
The following table presents a reconciliation of Net Loss, the most directly comparable GAAP measure, to EBITDA and Adjusted EBITDA.
__________________
(1) To reflect the change in value of the derivative liability associated with the July 2021 Convertible Notes
(2) Includes depreciation on fixed assets and amortization of acquired intangible assets.
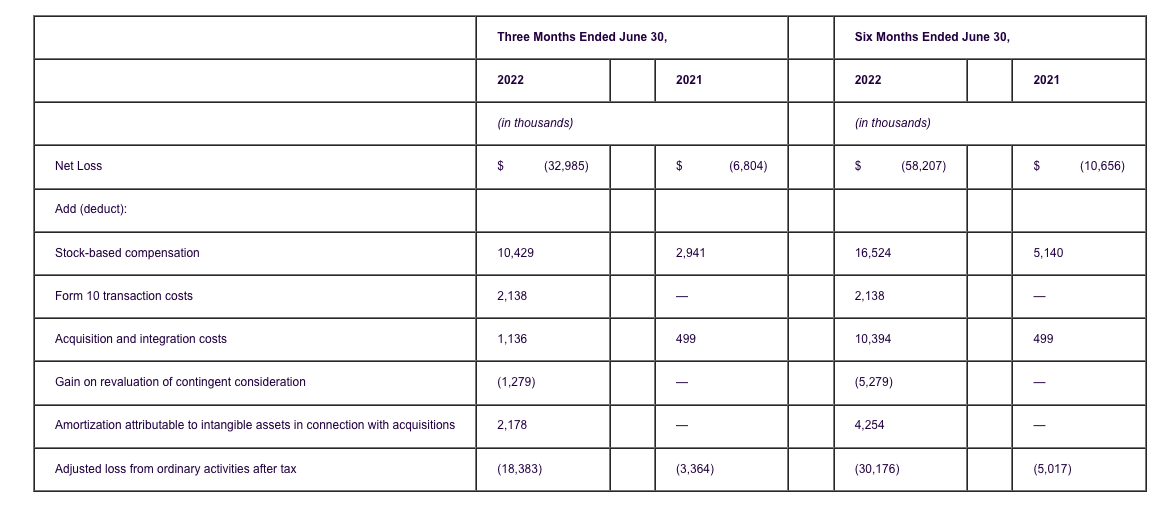
Adjusted loss from ordinary activities after tax
Adjusted loss from ordinary activities after tax is defined as Net Loss, excluding (i) stock-based compensation, (ii) Form 10 transaction costs, (iii) acquisition and integration costs, (iv) gain on revaluation of contingent consideration, and (v) amortization attributable to intangible assets in connection with acquisitions.
The above items are excluded from net loss because these items are non-cash in nature, or because the amount and timing of these items are unpredictable, are not driven by core results of operations and render comparisons with prior periods and competitors less meaningful. This non-GAAP financial measure is presented for supplemental informational purposes only, should not be considered a substitute for or superior to financial information presented in accordance with GAAP, and may be different from similarly titled non-GAAP financial measures used by other companies. As such, you should consider this non-GAAP financial measure in addition to other financial performance measures presented in accordance with GAAP, including various cash flow metrics, net loss and our other GAAP results.
The following table presents a reconciliation of net loss, the most directly comparable GAAP measure, to Adjusted loss from ordinary activities after tax.