Life360 reports Q3 2022 results
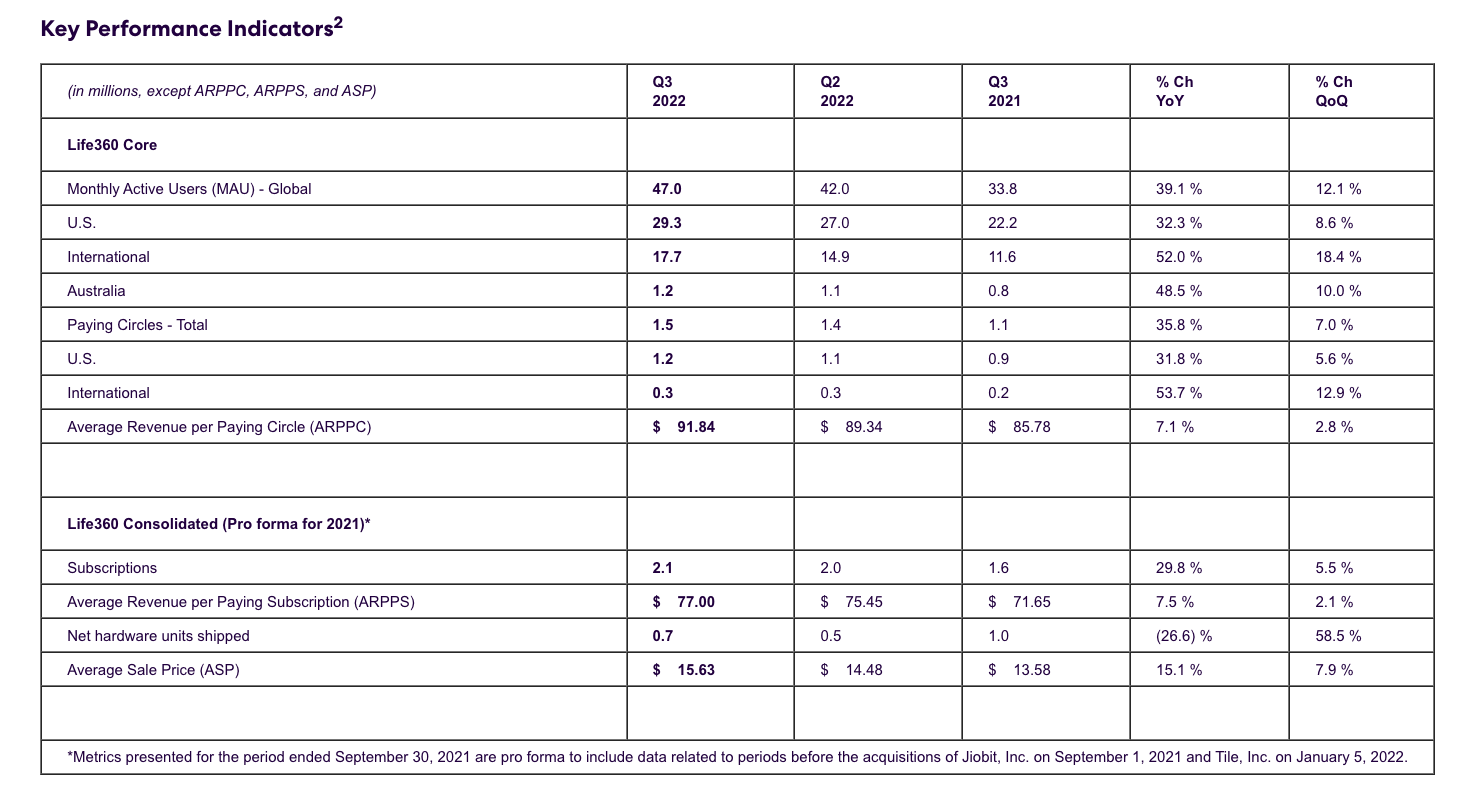
Largest ever quarterly growth in Global Monthly Active Users (MAU) of more than 5 million, up 39% YoY, with record net additions in both the U.S. and International markets
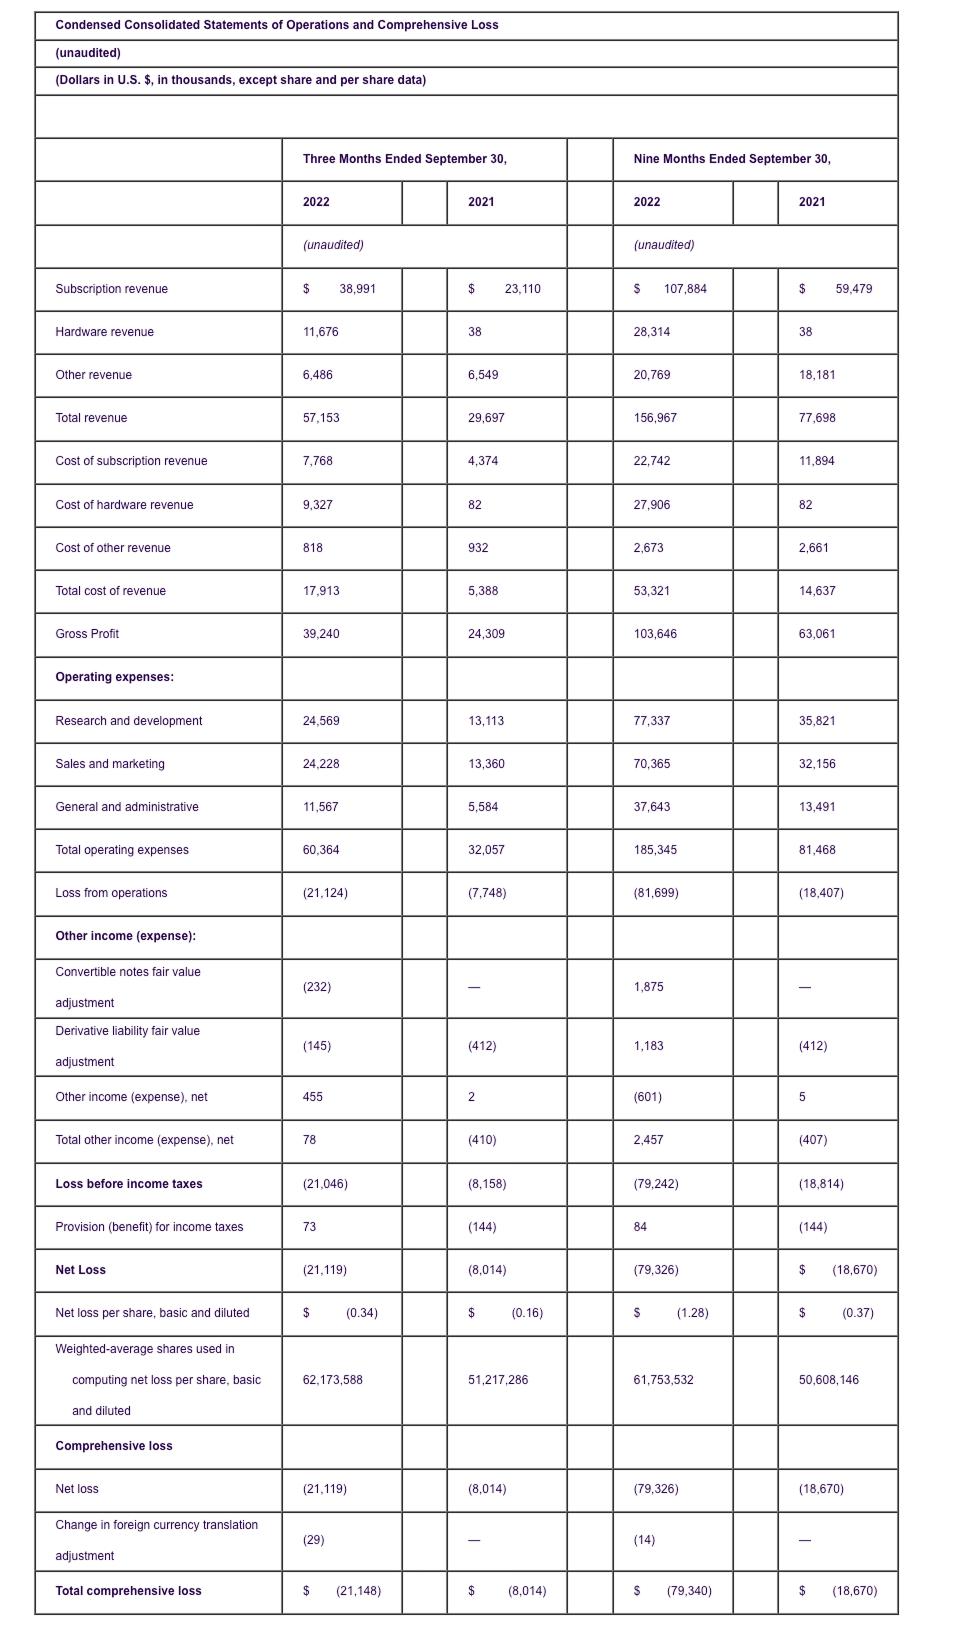
Q3 consolidated revenue growth of 92% to $57.2 million, with Q3 Paying Circles up 36% YoY
October 2022 Average Revenue Per Paying Circle (ARPPC) up 47% YoY for new U.S. subscribers, reflecting early benefits of higher pricing
Anticipated CY22 year-end Annualized Monthly Revenue1 (AMR) (excluding hardware) of more than $215 million, up >50% YoY
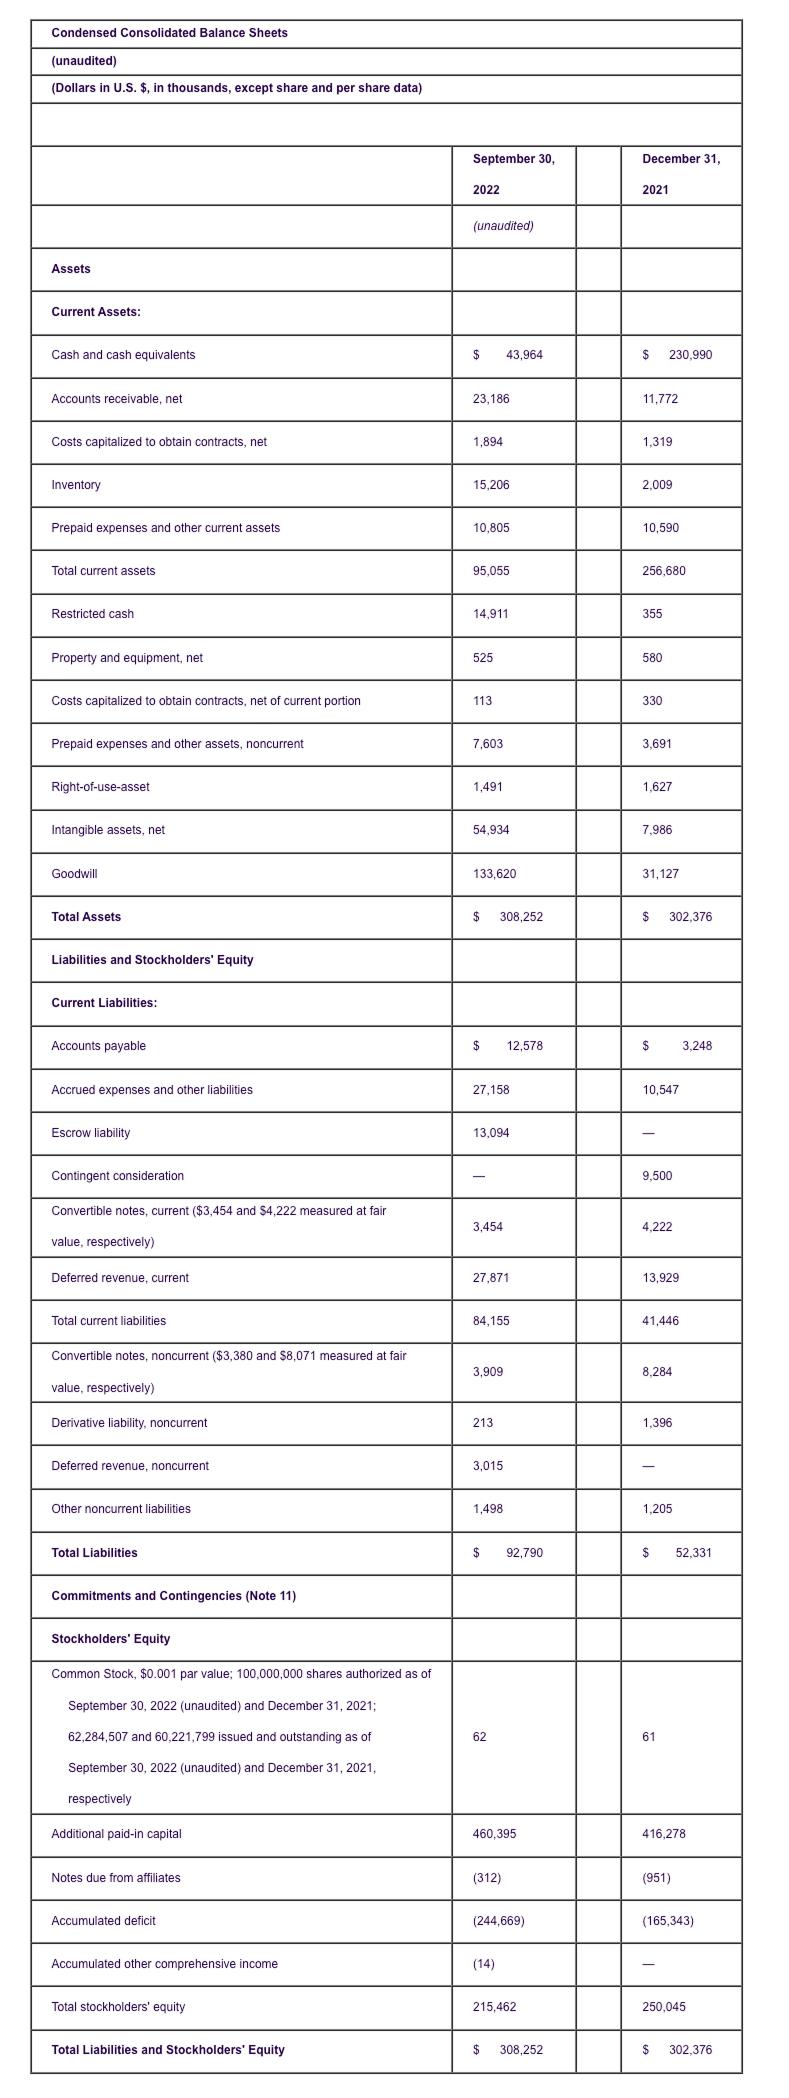
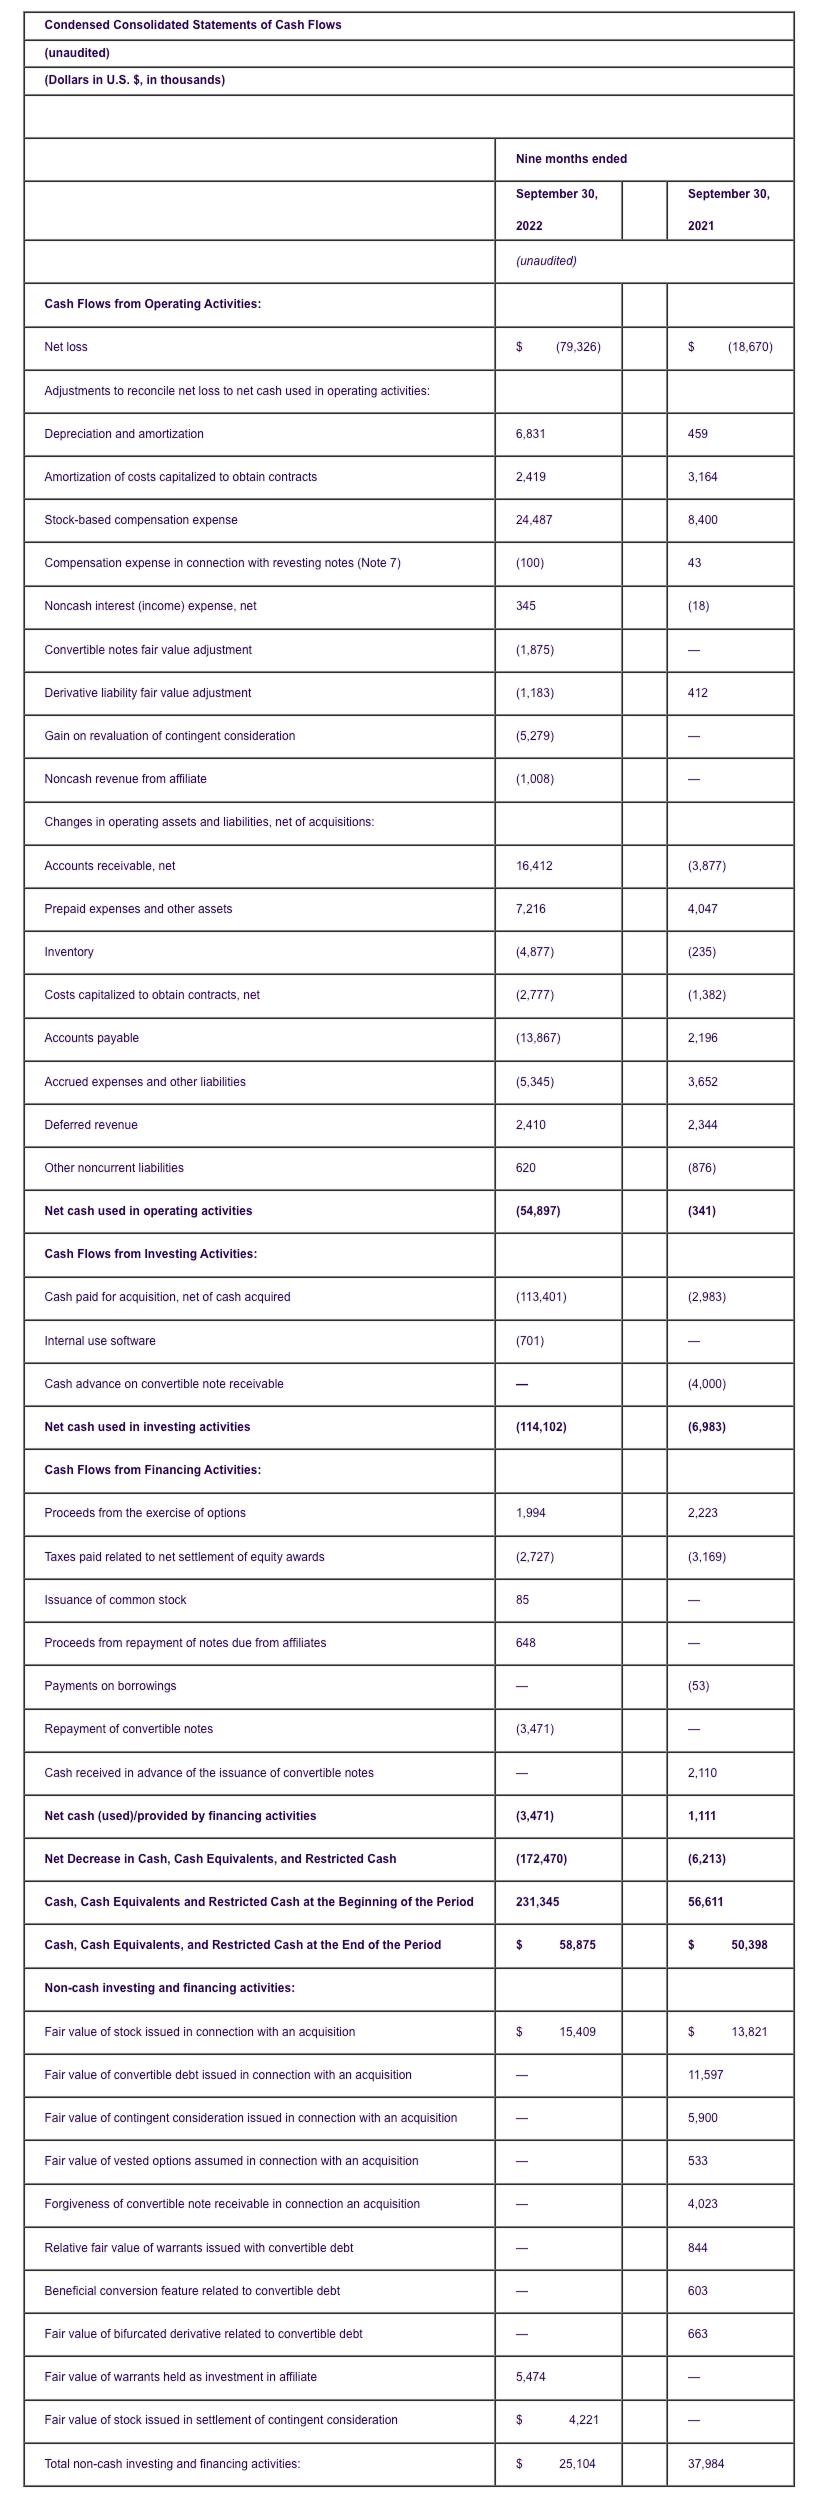
Quarter-end cash, cash equivalents and restricted cash of $58.9 million, including financing related cash outflows of approximately $4 million
Strong revenue growth from the price increase, and lower than expected initial churn, along with prudent financial management, result in acceleration of our targeted positive Adjusted EBITDA and Operating Cash Flow to CY23 Q3 versus prior guidance of CY23 Q4
SAN FRANCISCO, Nov. 14, 2022 /PRNewswire/ — San Francisco-based Life360, Inc. (Life360 or the Company) (ASX: 360) today reported financial results for the three and nine months ended September 30, 2022 (unaudited).
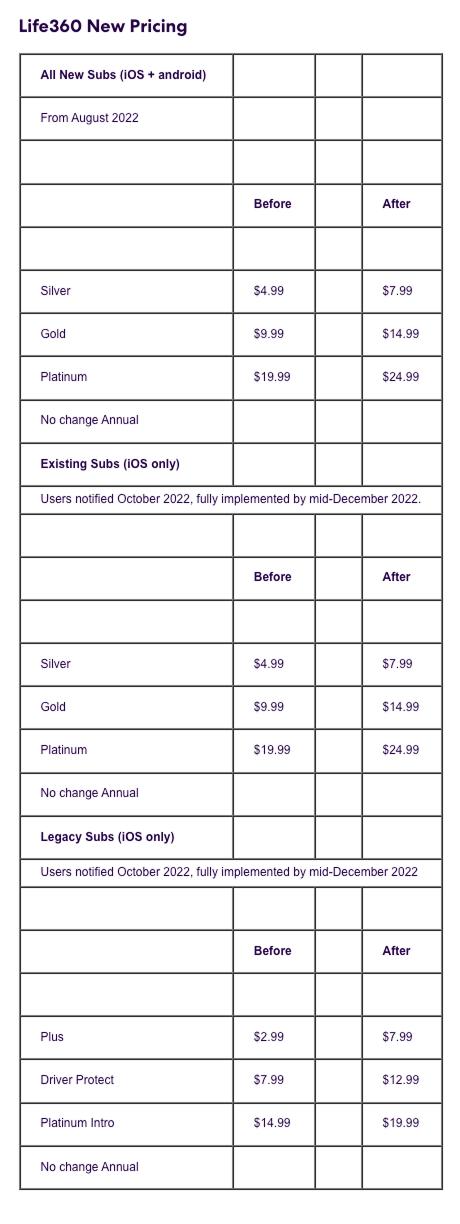
Life360 Chief Executive Officer Chris Hulls said: “We had an exceptionally strong Q3 back-to-school period, with our largest ever quarterly MAU growth both internationally and in the U.S. Additionally, AMR of $184 million is up 53% year-on-year, and we finished the quarter with cash and cash equivalents of $58.9 million. We delivered more than 100 thousand net Paying Circle additions in Q3 despite our price increase of almost 50% for new U.S. monthly subscribers, which took full effect in August, and is currently being implemented for existing iOS monthly subscribers, with full effect in December. This performance, together with lower than expected churn, is testament to the value we provide to our subscribers and sets us up for very strong recurring revenue growth in CY23.
“Tile’s Q3 hardware unit sales were in line with expectations, and improved versus Q2, which saw the impact of returns undertaken to right-size channel inventory and exit less profitable channels. However, we currently see headwinds in the U.S. consumer electronics market with major retailers taking a very cautious approach and significantly reducing targeted weeks of inventory for current orders into the holiday period. While this will likely result in Q4 hardware sales being below our previous forecasts, the impact on our CY22 Adjusted EBITDA and cash flow are expected to be much more limited due to continued strong momentum in Membership, disciplined cost control, and our prudent approach to hardware inventory. We expect to exit CY22 with AMR (excluding hardware) in excess of $215 million, a growth rate in excess of 50%.
“Looking forward to CY23, we believe we have very strong Membership revenue momentum due to our successful price increase, which lifted U.S. ARPPC by more than 47% year-on-year in October for new U.S. Membership subscribers. At the end of Q3, less than 10% of U.S. subscribers were on the new pricing tiers, providing significant ARPPC upside as higher pricing takes effect for all existing monthly iOS subscribers. While Q4 net adds will likely be flat due to the expected one-time increase in churn by existing subscribers, to date churn is well within our target parameter of a 10% reduction in retention. Importantly, we expect significant improvement in paid user conversion and retention from the full integration of hardware bundling, which is on track for early CY23 Q1 as the third phase of our integration plan. The initial integration phases included bundling via promotions, delivering the up to 10x expansion in the size of the Tile Finding Network and Tiles now visible on the Life360 map in the U.S., with international rollout to be completed in CY23 Q1.
“The benefits of bundling, together with our higher price points, give us the confidence to bring forward by a quarter our target for consistently positive Adjusted EBITDA and Operating Cash flow to CY23 Q3. This expectation takes into account turbulence in the macroeconomic environment, with current strong headwinds in standalone hardware retail, and incorporates an appropriate balance of fiscal responsibility with prudent investment, to leverage the many exciting growth opportunities that are available to us. We’re also encouraged by the steady progress we are making in driving efficiencies from integration, and controlling costs even in the face of increasing inflationary pressures, while maintaining our focus on the core customer experience.”
_______________________________
1 Annualized Monthly Revenue (AMR) is a Non-GAAP financial measure used by the Company to identify the annualized monthly value of active customer agreements at the end of a reporting period. Refer to the Non-GAAP Financial Measures section below for additional detail regarding how AMR is calculated.
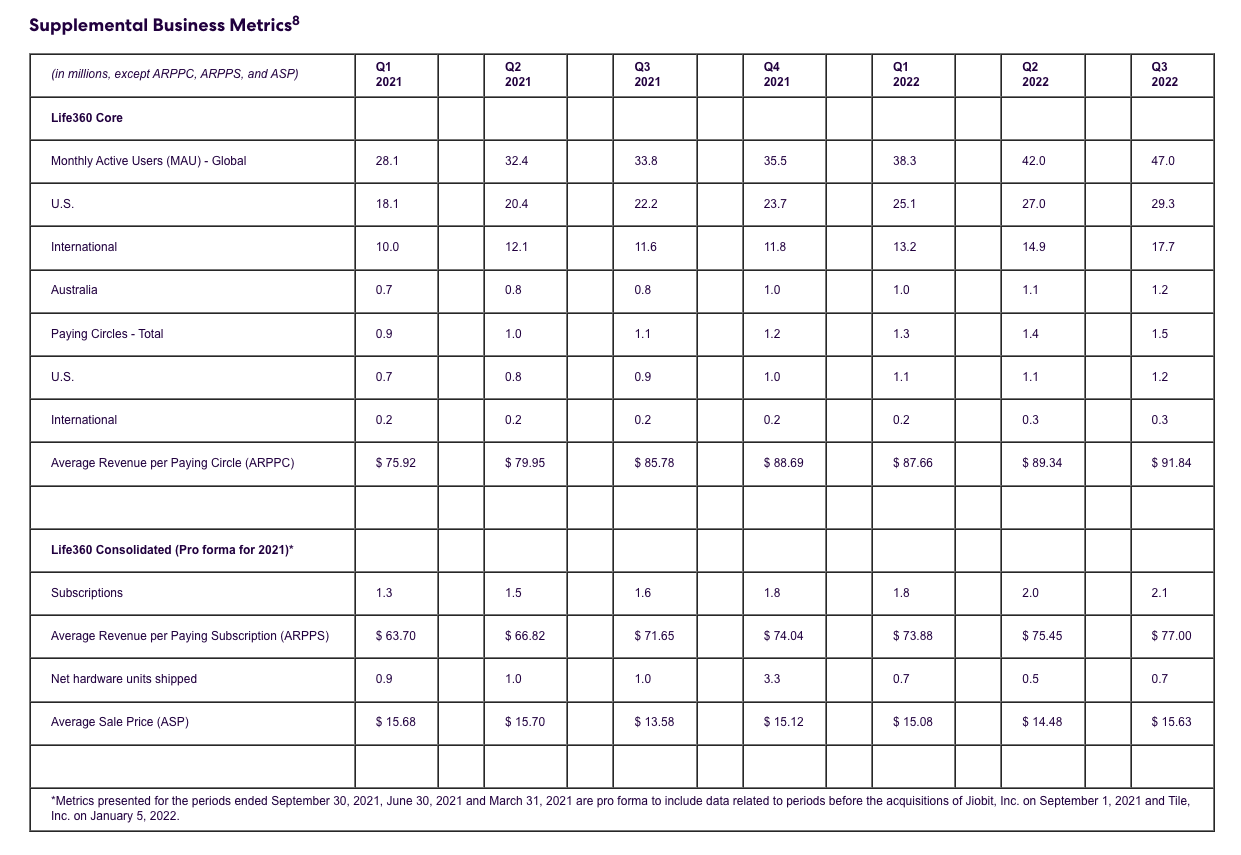
*Metrics presented for the period ended September 30, 2021 are pro forma to include data related to periods before the acquisitions of Jiobit, Inc. on September 1, 2021 and Tile, Inc. on January 5, 2022.
__________________________________
2 All references to $ are to U.S. $. Additionally, numbers may not add or recalculate due to rounding
Global MAU increased 39% YoY to 47.0 million, with record net additions in both the U.S. and International markets. U.S. MAU increased 32% YoY, with International delivering a 52% uplift due to ongoing strong growth in developed markets and surges in new users in Philippines and Japan.
Paying Circles delivered continued strong momentum – up 36% YoY – with net additions of 100 thousand. U.S. net adds held up strongly despite a significant price increase for new members introduced in August. International quarterly net adds were at record levels with nominal marketing spend.
U.S. Paying Circles increased 32% YoY, with cumulative new and upsell subscribers in the Membership plans of 813 thousand, up 80% YoY, comprising Silver 10%, Gold 85% and Platinum 6%. Membership now makes up 68% of U.S. Paying Circles.
Average Revenue per Paying Circle delivered ongoing momentum, lifting 7% year-over-year. U.S. growth of 10% was somewhat offset by currency impacts on International subscriptions.
Net Hardware units reduced YoY reflecting the backdrop of weaker consumer electronics category demand, while increasing versus Q2 which saw the impact of returns undertaken to right-size channel inventory, and exit less profitable sales channels. Actions undertaken in CY22 to optimize hardware inventory management mean we will be entering CY23 with appropriate inventory levels on hand for planned CY23 bundling, and in retail channels.
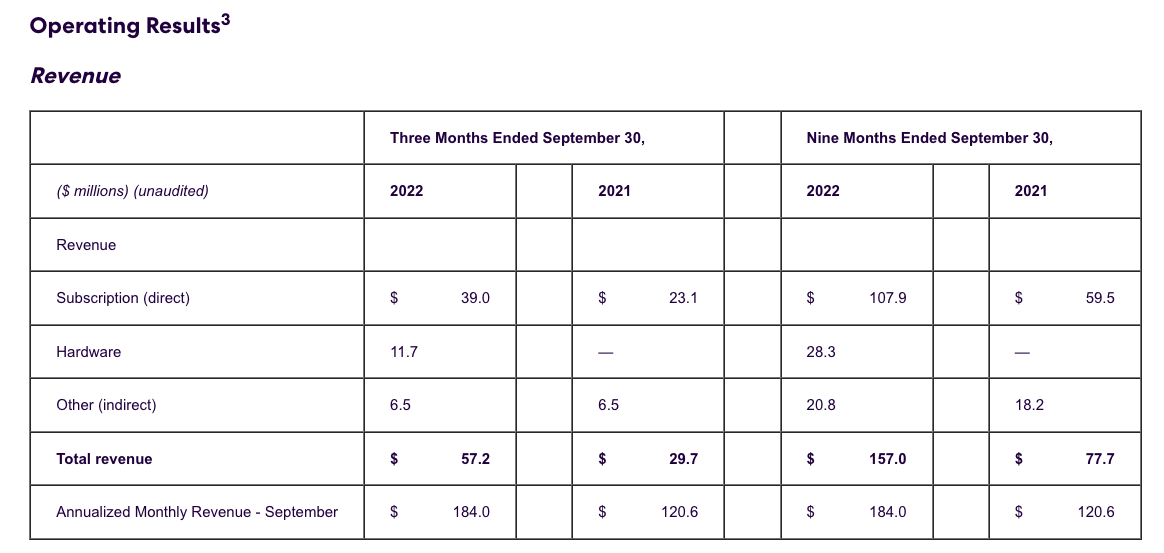
Q3’22 subscription revenue increased 70% YoY (including Tile and Jiobit). Life360 subscription revenue increased 48% YoY benefiting from ongoing growth in Paying Circles and 7% uplift in Average Revenue per Paying Circle.
Hardware revenue increased versus Q2 which was impacted by a deliberate strategic shift to prioritize higher margin sales channels and right-size channel inventory.
Q3’22 other revenue was stable as expected due to the transition to new data arrangement with Placer.ai.
September AMR increased 53% YoY reflecting strong subscription performance and the addition of Tile and Jiobit subscription revenue.
__________________________________
3 All references to $ are to U.S. $. Additionally, numbers may not add or recalculate due to rounding
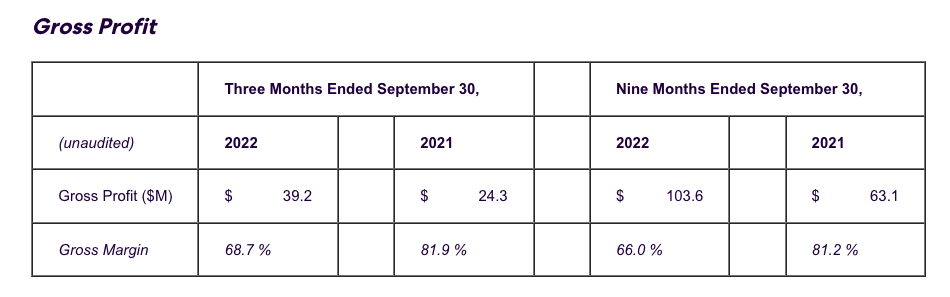
Gross profit margin reduced versus the prior period reflecting the Tile and Jiobit acquisitions, and hardware's traditionally lower gross margins. Excluding hardware, gross margins were stable at 81%.
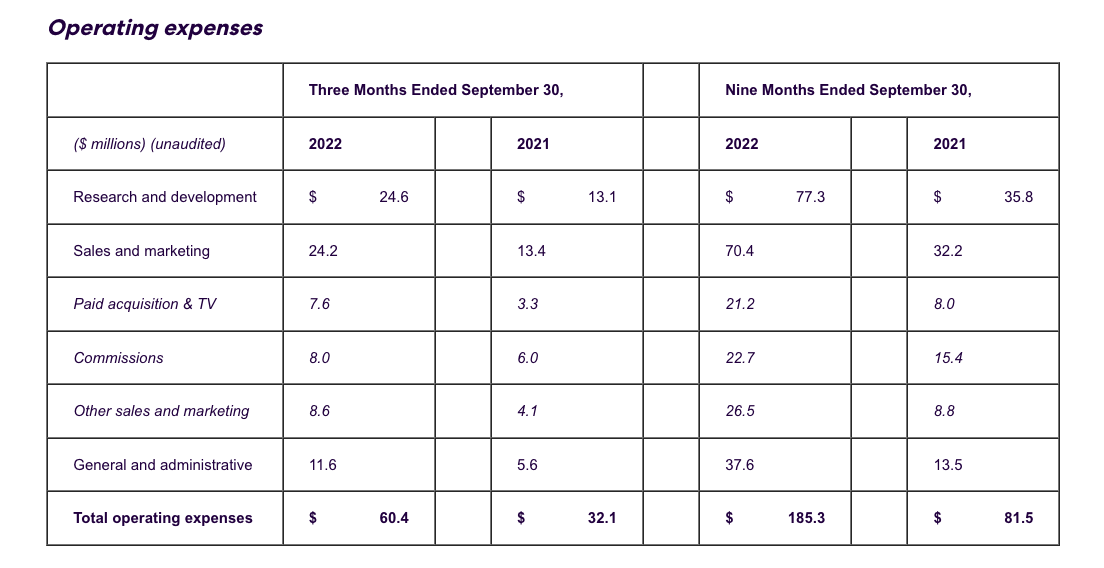
Year-on-year operating expense growth reflects the acquisitions of Tile and Jiobit and establishing the platform to support the rollout of the bundled Membership offering.
Q3 expenses reduced versus Q2 reflecting cost efficiencies realized from the leaner organizational structure implemented during the first half together with the impact of one-time costs. Specific initiatives have been successfully implemented in several areas, including consistent improvement in the unit economics of cloud computing costs.
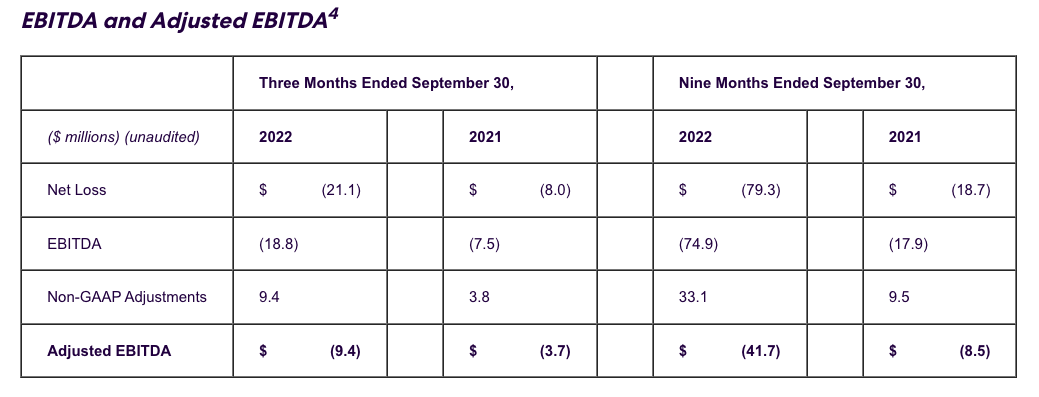
Q3’22 Adjusted EBITDA loss of $9.4 million reduced versus $18.7 million in Q2 reflecting strong subscription revenue growth, organizational cost efficiencies and benefits from Tile’s Q2 right-sizing of its inventory.
__________________________________
4 EBITDA and Adjusted EBITDA are non-GAAP measures. For definitions of EBITDA and Adjusted EBITDA and the use of these non-GAAP measures, as well as a reconciliation of Net Loss to EBITDA and Adjusted EBITDA, refer to the Non-GAAP Financial Measures section below. Additionally, numbers may not add or recalculate due to rounding.
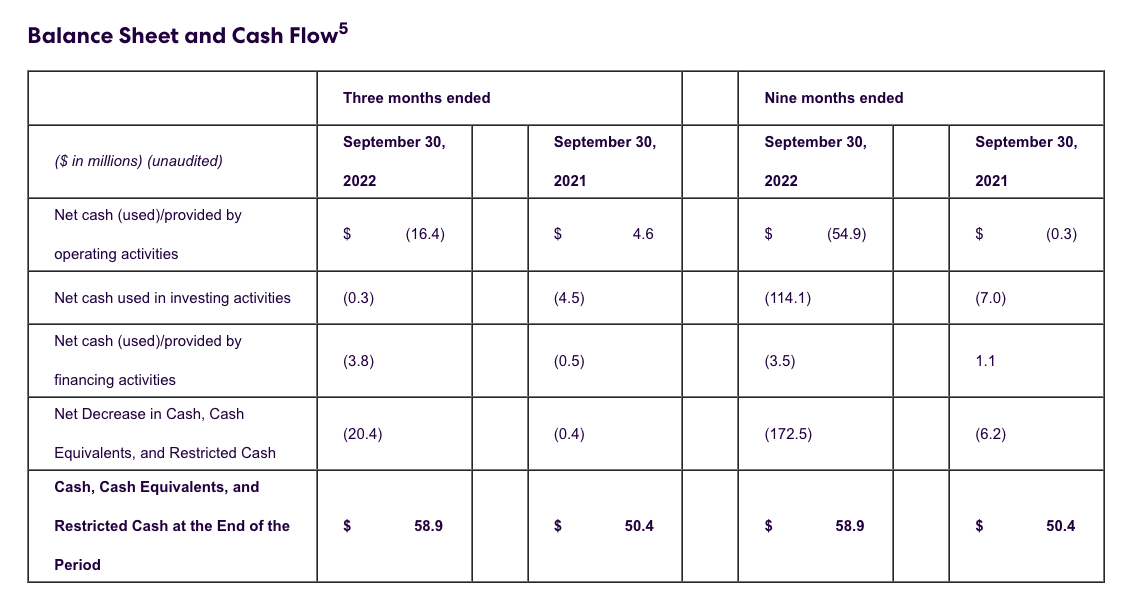
Life360 ended September 2022 with cash, cash equivalents and restricted cash of $58.9 million.
Q3’22 net cash used in operating activities of $16.4 million was largely in line with Q2. The difference to Adjusted EBITDA reflects timing differences relating to prepayments, returns processing, and acquisition and integration costs excluded from Adjusted EBITDA.
Q3’22 net cash used in financing activities of $3.8 million reflects the repayment of convertible notes associated with the Jiobit acquisition which came due as expected.
___________________________________
5 All references to $ are to U.S. $. Additionally, numbers may not add or recalculate due to rounding
Earnings Guidance6
As a result of our price increase, we expect to exit CY22 with significantly higher than previously anticipated AMR and ARPPC. The price increase is also expected to drive a one-time increase in churn that will result in largely flat net subscriber additions in Q4, ahead of subscriber growth resuming in CY23 Q1. While our guidance for continued strong subscription revenue performance is unchanged, our consolidated revenue expectations are lower due to continuing headwinds in the stand-alone hardware business. We will not have high levels of visibility on hardware revenues until after the traditional “Black Friday” holiday sales period in the U.S.
We remain very confident in our ability to use Tile devices to drive Membership in CY23 and beyond, and note that the strong momentum in our Membership business will likely mean that stand-alone hardware sales will continue to reduce as a proportion of group revenue in future years.
For CY22 Life360 expects to deliver:
Core Life360 subscription revenue (excluding Tile and Jiobit) growth in excess of 55%;
Consolidated revenue of $225-240 million for subscription (direct), hardware and other (indirect) revenue. The revenue range is highly dependent on Q4 stand-alone hardware performance;
Adjusted EBITDA7 loss in the range of $(37)-(41) million.
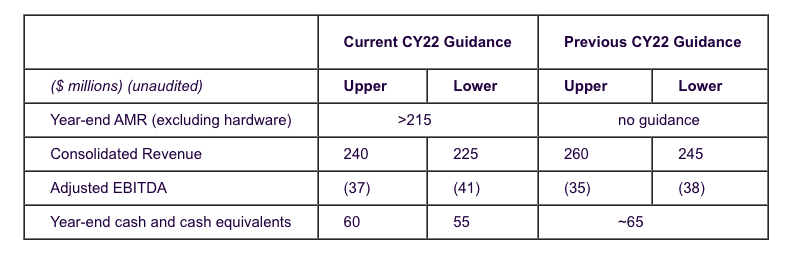
Life360 expects to finish CY22 with an Annualized Monthly Revenue (excluding hardware) of more than $215 million, noting this does not include any price changes for existing Android subscribers.
Year-end cash and cash equivalents are forecast in the range of $55-60 million, and we expect Life360 to be on a trajectory to consistently positive Adjusted EBITDA and Operating Cash Flow by CY23 Q3, such that we record positive Adjusted EBITDA and Operating Cash Flow for CY24. This target is being brought forward by one quarter, reflecting the very strong momentum in our recurring Membership revenues, and assumes no improvement in the current headwinds impacting stand-alone hardware sales. Additionally, the substantial discretionary spending levers in the business mean we are confident in Life360’s ability to fund its future growth.
___________________________________
6 In regards to forward looking non-GAAP guidance, we are not able to reconcile the forward-looking non-GAAP Adjusted EBITDA measure to the closest corresponding GAAP measure without unreasonable efforts because we are unable to predict the ultimate outcome of certain significant items, which are fluid and unpredictable in nature. In addition, the company believes such a reconciliation would imply a degree of precision that may be confusing or misleading to investors. These items include, but are not limited to, litigation costs, convertible notes and derivative liability fair value adjustments, and gain on revaluation of contingent consideration.
7 Adjusted EBITDA was previously referred to as Underlying EBITDA. For definitions of EBITDA and Adjusted EBITDA and the use of these non-GAAP measures, as well as a reconciliation of Net Loss to EBITDA and Adjusted EBITDA, refer to the Non-GAAP Financial Measures section below..
Investor Conference Call
A conference call will be held today at 9.30am AEDT, Tuesday 15 November 2022 (Monday 14 November 2022 U.S. PT at 2.30pm). The call will be held as a Zoom audio webinar.
Participants wishing to ask a question should register and join via their browser here. Participants joining via telephone will be in listen only mode.
Dial in details
Australia: +61 2 8015 6011U.S.: +1 669 900 6833Other countries: **details**Meeting ID: 988 0026 7809
A replay will be available after the call at https://investors.life360.com
Authorization
Chris Hulls, Director, Co-Founder and Chief Executive Officer of Life360 authorized this announcement being given to ASX.
About Life360
Life360 operates a platform for today’s busy families, bringing them closer together by helping them better know, communicate with, and protect the pets, people and things they care about most. The Company’s core offering, the Life360 mobile app, is a market leading app for families, with features that range from communications to driving safety and location sharing. Life360 is based in San Francisco and had approximately 47.0 million monthly active users (MAU) as of September 30, 2022, located in more than 150 countries. For more information, please visit life360.com.
Tile, a Life360 company, locates millions of unique items every day by giving everything the power of smart location. Leveraging its superior nearby finding features and vast community that spans over 150 countries, Tile’s cloud-based finding platform helps people find the things that matter to them most. In addition to trackers in multiple form factors for a variety of use cases, Tile’s finding technology is embedded in over 55 partner products across audio, travel, wearables, smart home, and PC categories. For more information, please visit Tile.com.
Contacts
For Australian investor inquiries:
Jolanta Masojada, +61 417 261 367
For Australian media inquiries:
Giles Rafferty, +61 481 467 903
grafferty@firstadvisers.com.au
For U.S. investors
For U.S. media inquiries:
Life360’s CDIs are issued in reliance on the exemption from registration contained in Regulation S of the US Securities Act of 1933 (Securities Act) for offers of securities which are made outside the US. Accordingly, the CDIs, have not been, and will not be, registered under the Securities Act or the laws of any state or other jurisdiction in the US. As a result of relying on the Regulation S exemption, the CDIs are ‘restricted securities’ under Rule 144 of the Securities Act. This means that you are unable to sell the CDIs into the US or to a US person who is not a QIB for the foreseeable future except in very limited circumstances until after the end of the restricted period, unless the re-sale of the CDIs is registered under the Securities Act or an exemption is available. To enforce the above transfer restrictions, all CDIs issued bear a FOR Financial Product designation on the ASX. This designation restricts any CDIs from being sold on ASX to US persons excluding QIBs. However, you are still able to freely transfer your CDIs on ASX to any person other than a US person who is not a QIB. In addition, hedging transactions with regard to the CDIs may only be conducted in accordance with the Securities Act.
Future performance and forward-looking statements
This announcement contains forward-looking statements within the meaning of the Private Securities Litigation Reform Act of 1995. Life360 intends such forward-looking statements to be covered by the safe harbor provisions for forward-looking statements contained in Section 21E of the Securities Exchange Act of 1934, as amended. These forward-looking statements can be about future events, including statements regarding Life360’s intentions, objectives, plans, expectations, assumptions and beliefs about future events, including Life360’s expectations with respect to the financial and operating performance of its business, its capital position, future growth and subscriber churn. The words “anticipate”, “believe”, “expect”, “project”, “predict”, “will”, “forecast”, “estimate”, “likely”, “intend”, “outlook”, “should”, “could”, “may”, “target”, “plan” and other similar expressions can generally be used to identify forward-looking statements. Indications of, and guidance or outlook on, future earnings or financial position or performance are also forward-looking statements. Investors and prospective investors are cautioned not to place undue reliance on these forward-looking statements as they involve inherent risk and uncertainty (both general and specific) and should note that they are provided as a general guide only. There is a risk that such predictions, forecasts, projections and other forward-looking statements will not be achieved. Subject to any continuing obligations under applicable law, Life360 does not undertake any obligation to publicly release the result of any revisions to these forward-looking statements to reflect events or circumstances after the date of this announcement, to reflect any change in expectations in relation to any forward-looking statements or any change in events, conditions or circumstances on which any such statements are based. While due care has been used in the preparation of forecast information, actual results may vary in a materially positive or negative manner. Forward-looking statements are provided as a general guide only and should not be relied on as an indication or guarantee of future performance. They are subject to known and unknown risks, uncertainty, assumptions and contingencies, many of which are outside Life360’s control, and are based on estimates and assumptions that are subject to change and may cause actual results, performance or achievements to differ materially from those expressed or implied by such statements. Factors that could cause actual results to differ materially from those in the forward-looking statements include risks described in the Company’s ASX filings, Form 10 Registration Statement and subsequent reports filed with the Securities and Exchange Commission. To the maximum extent permitted by law, responsibility for the accuracy or completeness of any forward-looking statements whether as a result of new information, future events or results or otherwise is disclaimed. This announcement should not be relied upon as a recommendation or forecast by Life360. Past performance information given in this document is given for illustrative purposes only and is not necessarily a guide to future performance and no representation or warranty is made by any person as to the likelihood of achievement or reasonableness of any forward-looking statements, forecast financial information, future share price performance or any underlying assumptions. Nothing contained in this document nor any information made available to you is, or shall be relied upon as, a promise, representation, warranty or guarantee as to the past, present or the future performance of Life360.
_____________________
8 All references to $ are to U.S. $. Additionally, numbers may not add or recalculate due to rounding
Non-GAAP Financial Measures
We collect and analyze operating and financial data to evaluate the health of our business, allocate our resources and assess our performance.
EBITDA and Adjusted EBITDA
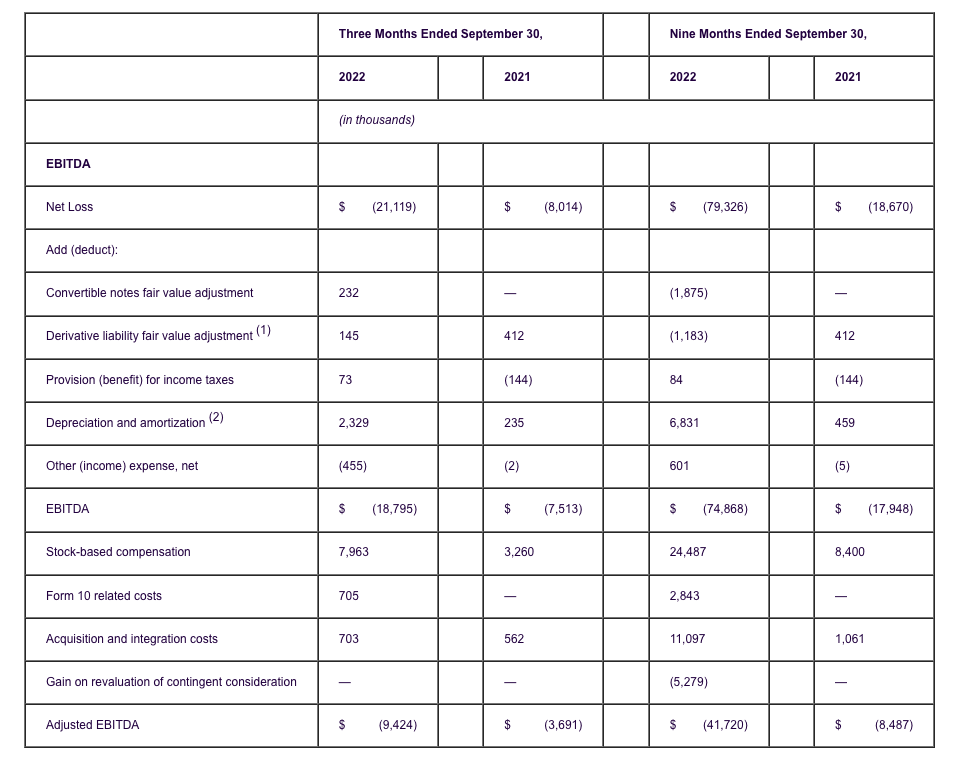
In addition to total revenue, Net Loss and other results under GAAP, we utilize non-GAAP calculations of earnings before interest, taxes, depreciation and amortization (“EBITDA”) and adjusted earnings before interest, taxes, depreciation and amortization (“Adjusted EBITDA”). EBITDA is defined as Net Loss, excluding (i) convertible notes and derivative liability fair value adjustments, (ii) provision (benefit) for income taxes, (iii) depreciation and amortization and (iv) other income (expense). Adjusted EBITDA is defined as Net Loss, excluding (i) convertible notes and derivative liability fair value adjustments, (ii) provision (benefit) for income taxes, (iii) depreciation and amortization, (iv) other income (expense), (v) stock-based compensation, (vi) costs related to filing our Registration Statement on Form 10 filed with the Securities and Exchange Commission on April 26, 2022, as amended by Amendment No. 1 filed on June 13, 2022 and Amendment No. 2 filed on July 5, 2022, and effective as of June 27, 2022 (“Form 10”), (vii) acquisition and integration costs, and (viii) gain on revaluation of contingent consideration.
The above items are excluded from EBITDA and Adjusted EBITDA because these items are non-cash in nature, or because the amount and timing of these items are unpredictable, are not driven by core results of operations and render comparisons with prior periods and competitors less meaningful. We believe EBITDA and Adjusted EBITDA provide useful information to investors and others in understanding and evaluating our results of operations, as well as providing useful measures for period-to-period comparisons of our business performance. Moreover, we have included EBITDA and Adjusted EBITDA in this Quarterly Report on Form 10-Q because they are key measurements used by our management team internally to make operating decisions, including those related to operating expenses, evaluate performance, and perform strategic planning and annual budgeting. However, these non-GAAP financial measures are presented for supplemental informational purposes only, should not be considered a substitute for or superior to financial information presented in accordance with GAAP, and may be different from similarly titled non-GAAP financial measures used by other companies. As such, you should consider these non-GAAP financial measures in addition to other financial performance measures presented in accordance with GAAP, including various cash flow metrics, Net Loss and our other GAAP results.
The following table presents a reconciliation of Net Loss, the most directly comparable GAAP measure, to EBITDA and Adjusted EBITDA.
___________________________________
(1) To reflect the change in value of the derivative liability associated with the July 2021 Convertible Notes (defined below).
(2) Includes depreciation on fixed assets and amortization of acquired intangible assets.
Annualized Monthly Revenue
We use Annualized Monthly Revenue (“AMR”) to identify the annualized monthly value of active customer agreements at the end of a reporting period. AMR includes the annualized monthly value of subscription, data and partnership agreements. All components of these agreements that are not expected to recur are excluded.